Football Conference
Season 2012–13
← 2011–12 2013–14 →
The 2012–13 Football Conference season was the ninth season in which the Conference consisted of three divisions and the thirty-third season overall. The Conference covers the top two levels of Non-League football in England. The Conference Premier is the fifth highest level of the overall pyramid, whilst the Conference North and Conference South exist at the sixth level. The Conference was won by Mansfield Town who together with Newport County , the winner of the play-off of the National division, were promoted to Football League Two , while the bottom four were relegated to the North or South divisions. The champions of the North and South divisions were promoted to the National division, alongside the play-off winners from each division. The bottom three in each of the North and South divisions were relegated to the premier divisions of the Northern Premier League , Isthmian League or Southern League .
For sponsorship reasons, the Conference Premier was referred to as the Blue Square Bet Premier.
Conference Premier Conference Premier
Season 2012–13
Matches 552
Goals 1,590 (2.88 per match)
Top goalscorer Matt Green (25 goals)Biggest home win Hyde 7–0 Woking (1 December 2012) Mansfield Town 8–1 Barrow (9 February 2013)Biggest away win Newport County 0–5 Forest Green Rovers (1 January 2013)Highest scoring Nuneaton Town 4–5 Ebbsfleet United (11 August 2012) Mansfield Town 8–1 Barrow (9 February 2013) Woking 5–4 Macclesfield Town (13 April 2013)Longest winning run 12 games Mansfield Town F.C. Longest unbeaten run 13 games Wrexham Longest winless run 30 games AFC Telford United Highest attendance 7,405 Grimsby Town 1–1 Lincoln City (1 January 2013) Average attendance 1,849
← 2011–122013–14 →
A total of 24 teams contested the division, including 18 sides from last season , two relegated from the Football League Two , two promoted from the Conference North and two promoted from the Conference South. The League started on 10 August 2012 with previously relegated Hereford United and Macclesfield Town facing each other at Edgar Street and finished on 20 April 2013 with all matches that day kicking off simultaneously. The 2013 Conference Premier play-off final on 5 May 2013 was the first Wembley Stadium final to feature two Welsh clubs, Newport County and Wrexham.
Promotion and relegation Teams promoted from 2011–12 Conference North
Teams promoted from 2011–12 Conference South
Teams relegated from 2011–12 Football League Two
League table Pos Team Pld W D L GF GA GD Pts Promotion, qualification or relegation 1 Mansfield Town (C, P)46 30 5 11 92 52 +40 95 Promotion to Football League Two 2 Kidderminster Harriers 46 28 9 9 82 40 +42 93 Qualification for the Conference Premier play-offs 3 Newport County (O, P)46 25 10 11 85 60 +25 85 4 Grimsby Town 46 23 14 9 70 38 +32 83 5 Wrexham 46 22 14 10 74 45 +29 80 6 Hereford United 46 19 13 14 73 63 +10 70 7 Luton Town 46 18 13 15 70 62 +8 67 8 Dartford 46 19 9 18 67 63 +4 66 9 Braintree Town 46 19 9 18 63 72 −9 66 10 Forest Green Rovers 46 18 11 17 63 49 +14 65 11 Macclesfield Town 46 17 12 17 65 70 −5 63 12 Woking 46 18 8 20 73 81 −8 62 13 Alfreton Town 46 16 12 18 69 74 −5 60 14 Cambridge United 46 15 14 17 68 69 −1 59 15 Nuneaton Town 46 14 15 17 55 63 −8 57 16 Lincoln City 46 15 11 20 66 73 −7 56 17 Gateshead 46 13 16 17 58 61 −3 55 18 Hyde 46 16 7 23 63 75 −12 55 19 Tamworth 46 15 10 21 55 69 −14 55 20 Southport 46 14 12 20 72 86 −14 54 21 Stockport County (R)46 13 11 22 57 76 −19 50 Relegation to Conference North 22 Barrow (R)46 11 13 22 45 83 −38 46 23 Ebbsfleet United (R)46 8 15 23 55 89 −34 39 Relegation to Conference South 24 AFC Telford United (R)46 6 17 23 52 79 −27 35 Relegation to Conference North
Play-offs First leg 23 April 2013 Wrexham 2–1 Kidderminster Harriers Racecourse Ground , Wrexham19:45 Artell 45+1' Ashton 84' (pen. )Gash 56' (pen. )Attendance: 6,315 Referee: Charles Breakspear
24 April 2013 Grimsby Town 0–1 Newport County Blundell Park , Cleethorpes19:45 Yakubu 89'Attendance: 5,414 Referee: Graham Horwood
Second leg 28 April 2013 Kidderminster Harriers 1–3 (2–5 agg.)Wrexham Aggborough , Kidderminster13:30 Dunkley 64'Ormerod 30' Vaughan 69' (o.g.) Ashton 85' (pen. )Attendance: 6,202 Referee: Seb Stockbridge
28 April 2013 Newport County 1–0 (2–0 agg.)Grimsby Town Rodney Parade , Newport16:30 Jolley 31'Attendance: 6,615 Referee: Kinsley
Final 5 May 2013 Wrexham 0–2 Newport County Wembley Stadium , London15:00 BST UTC+1 Jolley 86' O'Connor 90+4'Attendance: 16,346 Referee: Michael Bull
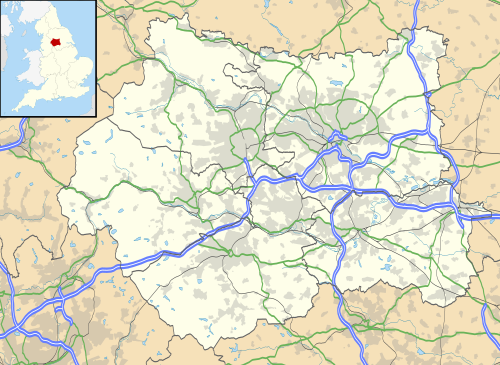
Stadia and locations Locations of the Conference Premier 2012–13 teams Team Stadium Capacity Stockport County Edgeley Park 10,852 Wrexham Racecourse Ground 10,500* Luton Town Kenilworth Road 10,226 Lincoln City Sincil Bank 10,120 Gateshead Gateshead International Stadium 10,000*** Mansfield Town Field Mill 10,000 Cambridge United Abbey Stadium 9,617 Grimsby Town Blundell Park 9,546 Macclesfield Town Moss Rose 6,355 AFC Telford United New Bucks Head 6,300 Kidderminster Harriers Aggborough 6,238 Woking Kingfield Stadium 6,036 Southport Haig Avenue 6,008 Hereford United Edgar Street 5,075 Newport County Rodney Parade 5,511** 1 Forest Green Rovers The New Lawn 5,147 Ebbsfleet United Stonebridge Road 5,011 Nuneaton Town Liberty Way 4,314 Barrow Holker Street 4,256 Hyde Ewen Fields 4,250 Braintree Town Cressing Road 4,145 Dartford Princes Park 4,100 Tamworth The Lamb Ground 4,000 Alfreton Town North Street 3,600
* Restricted due to stadium expansion or FA ruling. ** Capacity reduced for football matches from maximum capacity of 11,676. *** Groundshare from 15 February 2013.
1 Capacity was temporarily raised to 7,012 for the play-off tie against Grimsby Town
Results Home \ Away TEL ALF BRW BRA CAM DAR EBB FGR GAT GRI HER HYD KID LIN LUT MAC MAN NPC NUN SOU STP TAM WOK WRE AFC Telford United 0–0 1–1 3–0 1–2 0–2 2–2 1–2 0–0 1–2 0–4 1–3 0–2 1–1 0–0 0–2 2–2 2–4 0–3 1–3 2–2 3–3 1–0 0–2 Alfreton Town 1–1 4–0 1–1 1–1 3–2 3–0 2–1 3–2 0–2 0–3 5–1 1–1 0–2 3–0 1–2 0–3 4–3 0–3 3–3 2–3 3–0 0–3 1–2 Barrow 0–0 1–3 0–1 1–4 0–0 1–1 2–2 0–2 2–2 0–2 1–1 1–1 1–2 1–0 1–0 0–4 0–3 1–2 3–2 0–2 2–0 2–0 0–1 Braintree Town 3–2 2–1 2–3 0–3 0–2 3–1 3–1 2–1 2–0 0–2 2–2 1–1 0–3 2–0 0–3 2–1 1–2 2–2 1–3 0–0 2–1 1–1 1–5 Cambridge United 3–3 0–3 2–1 1–0 1–2 1–1 0–0 3–0 0–0 1–3 0–1 1–3 2–1 2–2 2–0 4–1 0–0 1–3 2–0 4–1 1–1 1–0 1–4 Dartford 1–4 5–1 0–1 0–0 1–1 3–1 0–1 3–0 1–2 4–0 2–1 1–0 2–4 1–0 2–0 2–0 2–1 0–1 2–2 1–1 2–3 4–1 2–1 Ebbsfleet United 1–3 0–0 2–4 0–1 2–4 2–2 0–2 3–1 1–1 1–0 3–2 1–1 1–1 1–3 0–4 3–1 1–1 1–1 4–1 0–0 1–1 2–2 1–1 Forest Green Rovers 0–0 1–1 1–1 4–1 1–1 2–3 4–1 1–0 0–1 0–1 3–1 0–1 3–0 1–2 1–1 1–2 1–2 1–0 0–1 4–1 1–2 3–1 0–0 Gateshead 1–1 2–0 0–1 1–2 0–0 2–0 2–0 1–1 1–1 3–2 3–0 2–0 1–1 5–1 2–2 4–1 0–0 0–2 2–2 1–1 0–2 2–1 0–1 Grimsby Town 1–0 4–2 0–0 3–0 0–1 0–2 3–1 1–0 3–0 1–1 2–0 1–3 1–1 4–1 0–1 4–1 3–0 0–0 2–2 1–2 2–0 5–1 1–0 Hereford United 1–1 3–3 2–1 0–0 4–2 1–0 4–2 1–2 1–1 0–2 1–2 0–1 3–2 1–0 2–1 1–2 2–3 0–0 2–2 1–2 5–2 2–1 0–1 Hyde 2–1 1–1 0–0 1–2 2–1 3–0 1–0 0–1 1–1 3–2 5–2 0–4 1–5 1–2 1–1 0–1 0–1 2–2 0–2 0–1 2–1 7–0 2–0 Kidderminster Harriers 1–0 3–1 2–0 2–1 3–2 5–1 3–2 0–1 1–1 0–0 0–1 3–0 3–0 0–2 3–0 2–3 3–2 1–0 2–2 4–0 4–1 2–2 2–0 Lincoln City 3–2 1–2 0–0 3–0 0–0 2–1 1–1 1–2 1–1 1–4 3–2 3–2 1–0 1–2 2–3 0–1 2–4 2–1 1–0 3–3 2–1 0–2 1–2 Luton Town 0–1 3–0 6–1 2–3 3–2 0–2 2–0 1–1 2–2 1–1 1–1 1–2 1–2 3–0 4–1 2–3 2–2 2–0 3–1 1–0 0–0 3–1 0–0 Macclesfield Town 2–1 1–2 2–0 2–1 2–1 2–0 1–2 1–2 0–4 1–3 0–1 3–2 1–0 2–1 1–1 0–3 1–1 0–0 2–2 1–1 2–0 0–0 2–0 Mansfield Town 1–0 1–2 8–1 2–0 3–1 5–0 4–1 1–0 4–0 2–0 1–1 1–0 0–2 0–0 2–2 3–1 3–4 1–0 1–0 4–1 2–0 3–1 1–0 Newport County 2–1 2–0 0–2 1–0 6–2 0–0 1–0 0–5 3–1 0–0 2–0 1–3 1–2 2–1 5–2 4–1 2–0 4–0 2–1 0–0 2–2 2–3 1–1 Nuneaton Town 3–1 1–0 1–1 2–4 2–2 1–0 4–5 1–1 0–1 1–0 0–0 3–1 0–1 1–0 0–0 3–3 1–1 1–2 0–1 2–0 2–1 0–0 0–0 Southport 0–3 0–2 5–2 0–2 2–1 2–2 1–0 1–2 2–1 1–1 2–2 0–1 1–3 4–2 1–3 3–2 1–2 0–2 3–1 1–1 0–3 1–2 1–4 Stockport County 2–2 1–0 3–1 1–3 1–1 0–1 3–1 2–1 1–2 1–2 2–3 0–2 1–0 2–0 0–1 3–4 1–3 1–0 3–2 3–4 0–1 1–2 2–3 Tamworth 0–0 1–1 1–3 1–4 1–2 3–2 0–1 2–1 2–0 0–1 2–2 2–0 0–1 1–0 1–2 0–0 0–1 1–2 2–1 2–1 1–0 2–1 0–1 Woking 5–2 1–2 3–1 1–4 2–1 1–0 1–0 2–0 2–1 0–1 1–1 2–1 2–2 1–1 3–1 5–4 1–2 1–3 6–1 2–3 1–0 2–3 2–0 Wrexham 4–1 1–1 3–0 1–1 1–0 2–2 4–1 2–1 1–1 0–0 1–2 2–0 1–2 2–4 0–0 0–0 2–1 2–0 6–1 2–2 3–1 2–2 3–1
Top scorers As of 21 April 2013
Rank Player Club Goals 1 Matt Green Mansfield Town 25 2 Adam Cunnington Tamworth 21 3 Michael Gash Kidderminster Harriers 20 4 Andy Brown Nuneaton Town 19 Anthony Malbon Kidderminster Harriers 6 Matthew Barnes-Homer Macclesfield Town 18 Bradley Bubb Woking Aaron O'Connor Newport County 9 Paul Clayton Alfreton Town 17 Andre Gray Luton Town
Conference North Conference North
Season 2012–13
Matches 462
Goals 1,444 (3.13 per match)
Biggest away win Droylsden 0–7 Bradford Park Avenue (3 March 2013)Highest scoring Corby Town 4–5 Bradford Park Avenue (1 September 2012)Highest attendance 3,685 Chester 1–0 Boston United (6 April 2013) Lowest attendance 99 Harrogate Town (29 January 2013 v Corby Town F.C. ) ← 2011–122013–14 →
A total of 22 teams competed in the division, including 18 sides which competed in the Conference North the previous season, two promoted from the Southern Football League and two from the Northern Premier League.
Promotion and relegation Teams promoted from 2011–12 Northern Premier League Premier Division
Teams promoted from 2011–12 Southern League Premier Division
League table Pos Team Pld W D L GF GA GD Pts Promotion, qualification or relegation 1 Chester (C, P)42 34 5 3 103 32 +71 107 Promotion to Conference Premier 2 Guiseley 42 28 7 7 83 45 +38 91 Qualification for the Conference North play-offs 3 Brackley Town 42 26 7 9 76 44 +32 85 4 Altrincham 42 24 8 10 100 51 +49 80 5 FC Halifax Town (O, P)42 21 12 9 86 38 +48 75 6 Harrogate Town 42 20 9 13 72 50 +22 69 7 Bradford (Park Avenue) 42 19 9 14 75 52 +23 66 8 Gainsborough Trinity 42 18 12 12 68 45 +23 66 9 Solihull Moors 42 17 9 16 57 53 +4 56 10 Oxford City 42 13 16 13 62 57 +5 55 11 Gloucester City 42 16 6 20 54 63 −9 54 12 Vauxhall Motors 42 15 8 19 58 64 −6 53 13 Stalybridge Celtic 42 13 13 16 55 62 −7 52 14 Workington 42 16 8 18 60 68 −8 52 15 Worcester City 42 14 8 20 57 62 −5 50 16 Boston United 42 14 7 21 68 73 −5 49 17 Bishop's Stortford 42 12 13 17 58 74 −16 49 Transferred to Conference South 18 Colwyn Bay 42 14 7 21 57 78 −21 49 19 Histon 42 11 11 20 48 73 −25 44 20 Corby Town (R)42 12 8 22 66 92 −26 44 Relegation to the Southern League Premier Division 21 Droylsden (R)42 5 7 30 43 124 −81 22 Relegation to the Northern Premier League Premier Division 22 Hinckley United (R)42 3 4 35 37 143 −106 7 Relegation to the Southern League Premier Division
Play-offs First leg 30 April 2013 Altrincham 2–1 Brackley Town Moss Lane , Altrincham19:45 Richman 77' Moult 90'Louis 70'Attendance: 1,618
30 April 2013 FC Halifax Town 1–1 Guiseley The Shay , Halifax20:00 Gardner 17'Ellis 60' Attendance: 2,367
Second leg 4 May 2013 Guiseley 0–2 FC Halifax Town Nethermoor Park, Guiseley 15:00 A. Johnson 51' Gregory 82' Attendance: 2,424
4 May 2013 Brackley Town 3–0 Altrincham St James Park, Brackley 15:00 Louis 4' Reid 25' Walker 53'Attendance: 1,353
Final 12 May 2013 Brackley Town 0–1 FC Halifax Town St James Park, Brackley 15:00 Gregory 76'Attendance: 2,604
Stadia and locations Locations of the Conference North 2011–12 teams Locations of the Conference North 2011–12 teams Team Stadium Capacity Altrincham Moss Lane 6,085 Bishop's Stortford Woodside Park 4,000 Boston United York Street 6,643 Brackley Town St James Park 3,500 Bradford Park Avenue Horsfall Stadium 3,500 Chester Deva Stadium 6,000 Colwyn Bay Llanelian Road 2,500 Corby Town Steel Park 3,893 Droylsden Butcher's Arms Ground 3,000 FC Halifax Town The Shay 14,061 Gainsborough Trinity The Northolme 4,304 Gloucester City Whaddon Road (Groundshare with Cheltenham Town )7,066 Guiseley Nethermoor Park 3,000 Harrogate Town Wetherby Road 3,800 Hinckley United Greene King Stadium 4,329 Histon Bridge Road 4,300 Oxford City Court Place Farm 2,000 Solihull Moors Damson Park 3,050 Stalybridge Celtic Bower Fold 6,500 Vauxhall Motors Rivacre Park 2,500 Worcester City St George's Lane 4,850 Workington Borough Park 3,101
Results Home \ Away ALT BST BOS BRK BPA CHR COL COR DRO HAL GAI GLO GUI HAR HIN HIS OXC SOL STL VAU WRC WRK Altrincham 2–1 7–1 1–4 3–1 2–4 1–1 2–1 6–0 2–0 0–1 2–0 1–3 3–0 8–0 5–0 3–1 2–1 2–1 1–0 2–0 1–2 Bishop's Stortford 1–1 1–0 1–3 2–1 1–2 2–2 2–1 2–1 1–2 1–5 1–2 2–5 0–2 1–1 3–1 0–0 4–1 0–0 2–2 0–1 0–3 Boston United 2–3 1–1 3–4 0–4 3–2 1–0 1–1 5–1 1–2 2–1 4–0 1–3 1–2 1–2 6–0 3–1 2–2 2–2 0–1 1–2 1–3 Brackley Town 0–1 1–0 0–2 3–1 2–3 1–3 2–4 3–2 0–0 2–2 0–1 1–0 2–1 5–0 2–1 0–0 2–1 4–1 1–0 2–0 3–1 Bradford Park Avenue 2–2 2–1 2–1 0–1 0–0 1–2 2–0 5–0 1–1 0–2 2–1 1–3 1–0 4–0 0–0 1–2 1–0 1–3 2–0 2–2 1–0 Chester 2–0 4–1 1–0 0–0 1–1 2–1 2–1 5–0 2–1 3–1 2–0 4–0 2–0 3–0 2–1 2–0 0–1 4–1 2–0 4–2 1–0 Colwyn Bay 1–3 1–2 0–2 1–1 1–2 1–5 1–0 1–3 0–3 1–0 1–0 0–2 1–2 3–2 3–1 3–1 3–1 2–3 2–4 0–3 1–4 Corby Town 2–5 2–2 2–1 0–4 4–5 1–2 3–1 5–0 1–5 0–0 3–2 2–3 0–2 5–3 0–0 1–1 2–3 1–0 0–1 1–0 1–3 Droylsden 0–5 1–2 0–1 0–3 0–7 3–4 2–0 2–2 0–6 1–3 1–0 0–3 1–3 3–2 2–2 1–3 2–4 1–1 5–2 0–2 0–1 FC Halifax Town 3–4 1–1 1–2 0–0 0–1 1–1 0–1 2–0 4–1 3–1 5–0 1–1 1–2 7–0 3–3 3–1 0–0 0–0 4–0 5–0 5–1 Gainsborough Trinity 2–4 2–2 2–2 0–1 1–1 0–2 3–1 2–2 3–0 3–0 0–1 1–2 1–1 5–0 1–0 1–2 1–1 1–2 2–1 1–0 1–1 Gloucester City 0–0 5–1 1–0 1–4 1–0 0–1 2–2 0–1 4–0 1–2 1–2 2–2 0–2 4–1 1–1 0–1 1–1 4–3 1–1 4–2 0–1 Guiseley 1–1 1–2 2–1 0–2 1–0 2–1 2–2 2–1 7–1 1–1 2–0 3–1 2–0 2–4 2–1 1–0 1–0 1–0 2–1 3–3 2–0 Harrogate Town 1–2 2–2 4–2 6–1 1–1 1–3 1–2 6–1 1–1 1–1 0–0 1–0 1–2 5–0 2–0 1–3 2–4 0–0 3–1 3–1 3–1 Hinckley United 0–6 1–5 2–4 1–3 1–4 0–6 1–3 6–3 2–2 0–2 0–2 0–3 0–3 0–2 0–1 0–2 1–1 0–3 0–6 0–5 1–1 Histon 2–0 2–0 1–1 3–0 1–4 1–4 2–1 3–4 3–1 0–1 0–3 2–1 1–4 1–3 2–1 1–1 0–0 0–2 2–0 0–0 3–0 Oxford City 2–2 1–1 4–2 2–1 1–1 0–1 1–2 2–0 2–2 2–2 1–1 1–2 0–3 0–0 6–2 0–0 1–2 0–0 1–1 2–2 5–0 Solihull Moors 2–1 0–1 1–0 0–1 3–1 0–3 2–0 3–0 2–1 0–3 0–2 2–3 2–0 2–0 1–0 1–1 1–2 1–0 2–3 0–1 2–2 Stalybridge Celtic 2–2 3–1 0–1 0–3 2–0 2–6 3–3 1–2 0–0 1–0 1–1 4–0 1–1 1–0 4–0 2–1 2–2 0–3 0–1 0–2 1–4 Vauxhall Motors 2–1 2–2 4–0 0–2 1–3 0–3 1–1 1–1 4–0 1–3 1–2 1–2 2–0 0–1 2–1 2–0 2–1 2–1 0–0 1–0 1–3 Worcester City 0–0 2–0 0–3 1–2 2–0 0–1 2–0 5–1 2–1 0–1 0–3 0–1 0–1 2–2 3–1 2–3 3–2 1–3 1–2 2–2 1–1 Workington 2–1 2–3 1–1 0–0 1–6 1–1 1–2 2–3 2–1 0–1 0–3 0–1 0–2 1–2 2–1 3–1 1–2 1–1 4–1 3–1 1–0
Top scorers As of 29 April 2013
Rank Player Club Goals 1 Damian Reeves Altrincham 36 2 Marc Newsham Boston United 21 3 Lee Gregory FC Halifax Town 20 Josh Wilson Guiseley 5 Gareth Arnison Workington 19 6 Richard Marshall Bradford Park Avenue 16 7 Omar Bogle Solihull Moors 15 8 Nathan Jarman Chester FC 14 James Walshaw Guiseley Duncan Watmore Altrincham Spencer Weir-Daley Boston United
Conference South Conference South
Season 2012–13
Goals 1,407
← 2011–122013–14 →
A total of 22 teams competed in the division, including 18 sides which competed in the Conference South the previous season, two relegated from the Conference Premier and two promoted from the Isthmian Premier League.
Promotion and relegation Teams promoted from 2011–12 Isthmian League Premier Division
Teams relegated from 2011–12 Conference Premier
League table Pos Team Pld W D L GF GA GD Pts Promotion, qualification or relegation 1 Welling United (C, P)42 26 8 8 90 44 +46 86 Promotion to Conference Premier 2 Salisbury City (O, P)42 25 8 9 80 47 +33 82 Qualification for the Conference South play-offs 3 Dover Athletic 42 22 10 10 69 44 +25 76 4 Eastleigh 42 22 6 14 79 61 +18 72 5 Chelmsford City 42 22 6 14 70 56 +14 72 6 Sutton United 42 20 10 12 66 49 +17 70 7 Weston-super-Mare 42 19 10 13 61 55 +6 67 8 Dorchester Town 42 19 8 15 59 62 −3 65 9 Boreham Wood 42 15 17 10 59 46 +13 62 10 Havant & Waterlooville 42 14 16 12 68 60 +8 58 11 Bath City 42 15 10 17 60 58 +2 55 12 Eastbourne Borough 42 14 9 19 42 52 −10 51 13 Farnborough 42 19 7 16 76 75 +1 50 14 Basingstoke Town 42 12 12 18 63 73 −10 48 15 Bromley 42 14 6 22 54 69 −15 48 16 Tonbridge Angels 42 12 12 18 56 77 −21 48 17 Hayes & Yeading United 42 13 9 20 64 89 −25 48 18 Staines Town 42 13 8 21 61 78 −17 47 19 Maidenhead United 42 13 6 23 64 68 −4 45 20 AFC Hornchurch (R)42 11 11 20 47 64 −17 44 Relegation to the Isthmian League Premier Division 21 Billericay Town (R)42 11 7 24 62 90 −28 40 22 Truro City (R)42 9 8 25 57 90 −33 25 Relegation to the Southern League Premier Division
Play-offs First leg 30 April 2013 Chelmsford City 1–0 Salisbury City Melbourne Stadium, Chelmsford 19:45 Cook 89' (pen. )Attendance: 1,248
30 April 2013 Eastleigh 1–3 Dover Athletic Silverlake Stadium, Eastleigh 19:45 Zebroski 66'Ademola 1' May 18' McMahon 90'Attendance: 915
Second leg Final 11 May 2013 Salisbury City 3–2 (a.e.t.)Dover Athletic The Raymond McEnhill Stadium , SalisburyWhite 2' Wellard 50' Sinclair 99' Bricknell 2' Simpempa 89' Attendance: 3,408
Stadia and locations Locations of the Conference South 2011–12 teams Team Stadium Capacity AFC Hornchurch Hornchurch Stadium 3,500 Basingstoke Town The Camrose 6,000 Bath City Twerton Park 8,840 Billericay Town New Lodge 3,500 Boreham Wood Meadow Park 4,502 Bromley Courage Stadium 6,000 Chelmsford City Melbourne Stadium 3,019 Dorchester Town The Avenue Stadium 5,009 Dover Athletic Crabble Athletic Ground 6,500 Eastbourne Borough Priory Lane 4,134 Eastleigh Silverlake Stadium 3,000 Farnborough Cherrywood Road 4,000 Havant & Waterlooville West Leigh Park 5,250 Hayes & Yeading United Kingfield Stadium (Groundshare with Woking )6,036 Maidenhead United York Road 3,000 Salisbury City The Raymond McEnhill Stadium 5,000 Staines Town Wheatsheaf Park 3,009 Sutton United Gander Green Lane 7,032 Tonbridge Angels Longmead Stadium 3,000 Truro City Treyew Road 3,500 Welling United Park View Road 4,000 Weston-super-Mare Woodspring Stadium 3,500
Results Home \ Away AFC BAS BAT BIL BOR BRO CHE DOR DOV EAB EAS FAR H&W H&Y MDH SAL STA SUT TON TRU WEL WSM AFC Hornchurch 3–0 2–1 1–0 1–1 1–0 0–2 1–0 0–1 0–1 1–0 1–1 2–2 2–0 0–2 2–2 1–1 1–1 1–1 1–2 0–3 0–0 Basingstoke Town 0–2 2–1 3–3 2–3 1–1 1–2 2–1 0–1 2–2 0–3 6–2 1–2 2–2 2–0 0–4 3–1 2–1 1–0 3–2 0–1 1–3 Bath City 3–1 1–1 2–1 0–0 0–2 2–2 2–3 1–2 2–2 1–1 3–2 2–0 2–3 3–1 0–0 0–1 0–4 3–0 1–1 1–0 1–2 Billericay Town 1–1 1–3 2–0 1–1 2–3 0–1 3–1 1–2 1–2 4–0 2–1 3–1 4–1 1–0 1–2 2–3 2–4 3–3 2–1 1–2 0–0 Boreham Wood 2–1 1–1 0–0 3–0 1–2 0–0 1–2 1–1 2–1 3–0 3–1 1–2 3–0 2–1 1–0 1–1 3–0 4–2 0–0 1–1 0–1 Bromley 4–0 1–2 1–0 0–1 1–1 2–0 2–1 0–4 0–2 3–1 1–3 1–1 0–4 3–2 1–2 0–0 0–2 1–1 4–0 0–2 0–1 Chelmsford City 1–4 2–0 0–1 1–1 2–1 3–2 4–0 0–3 1–0 1–1 6–0 1–1 6–2 3–1 2–1 3–2 1–0 2–1 3–2 2–3 2–1 Dorchester Town 3–1 2–2 2–1 6–1 0–0 0–4 1–0 1–0 2–1 1–0 2–0 0–0 2–2 4–0 2–1 0–4 0–1 1–2 2–2 2–1 2–1 Dover Athletic 1–0 0–5 2–0 4–1 0–1 1–0 0–1 0–0 0–0 2–0 2–2 2–2 2–1 2–0 1–3 0–1 1–1 0–1 3–2 3–2 3–1 Eastbourne Borough 1–1 1–0 0–3 2–1 1–1 3–0 1–2 0–0 0–3 1–0 0–1 0–1 2–1 0–2 1–2 2–0 0–1 1–2 1–0 0–3 0–2 Eastleigh 1–0 1–1 3–1 5–0 1–1 3–0 1–0 3–1 1–3 1–0 3–1 2–2 3–1 4–2 1–0 4–3 1–0 4–1 3–1 1–3 3–0 Farnborough 1–1 2–1 0–1 4–3 0–3 2–0 3–1 1–1 5–2 0–1 6–2 1–1 4–1 2–1 2–1 3–1 1–3 4–1 4–1 0–3 2–1 Havant & Waterlooville 5–2 4–1 2–1 5–0 1–1 1–2 1–1 4–0 1–1 2–3 0–3 0–1 2–1 2–1 2–2 3–1 3–0 2–2 1–0 0–1 0–3 Hayes & Yeading United 1–3 2–1 2–2 4–2 0–1 1–1 3–0 1–3 2–4 1–1 2–1 3–2 1–4 1–1 2–3 4–0 0–0 3–2 1–2 2–1 2–1 Maidenhead United 2–4 2–2 0–1 3–2 2–1 4–2 2–1 1–2 1–2 1–2 0–2 3–2 2–0 0–2 0–1 1–1 0–1 3–1 8–0 2–1 0–1 Salisbury City 2–1 0–2 3–2 2–0 2–2 3–1 3–2 4–0 1–1 1–0 5–3 1–0 5–1 2–0 1–1 3–1 1–0 2–0 4–3 2–1 1–1 Staines Town 3–1 2–0 1–3 1–2 1–1 3–1 1–3 2–1 0–2 0–2 1–3 1–2 1–1 7–1 0–6 3–2 1–4 1–4 1–0 2–2 1–1 Sutton United 3–1 3–2 0–2 3–0 2–1 4–3 1–0 1–2 2–2 2–0 2–1 0–1 1–1 5–1 1–1 1–0 1–2 2–2 0–1 2–1 1–3 Tonbridge Angels 1–0 0–0 3–4 1–1 4–2 0–3 0–4 0–2 2–1 1–1 3–1 2–3 1–0 1–1 2–1 1–2 1–0 1–1 3–2 1–1 1–1 Truro City 3–2 2–2 2–1 2–4 2–0 0–1 1–2 1–2 0–3 2–2 1–3 3–3 3–3 3–1 0–1 1–1 0–3 1–2 2–0 0–3 1–2 Welling United 4–0 1–1 1–1 5–2 4–0 3–1 3–0 3–2 1–1 2–0 1–1 2–0 1–0 3–0 3–2 1–0 3–2 2–2 4–1 4–3 4–1 Weston-super-Mare 1–0 5–2 1–4 1–0 2–4 3–0 3–0 2–0 0–3 3–2 2–4 1–1 2–2 1–1 1–1 0–3 1–0 1–1 2–0 0–2 2–0
Top scorers As of 29 April 2013
Rank Player Club Goals 1 Ollie Palmer Havant & Waterlooville 25 2 Jamie Slabber Chelmsford City 23 3 Jamie White Salisbury City 21 4 Kieffer Moore Dorchester Town 20 5 Francis Collin Tonbridge Angels 19 Ross Lafayette Welling United Ben May Dover Athletic 8 Dan Fitchett Salisbury City 18 Jai Reason Eastleigh 10 Craig McAllister Eastleigh 17 11 Pierre Joseph-Dubois Bromley 16