This page provides supplementary chemical data on acetonitrile .
Material Safety Data Sheet The handling of this chemical may incur notable safety precautions. It is highly recommend that you seek the Material Safety Datasheet (MSDS ) for this chemical from a reliable source and follow its directions.
Structure and properties Structure and properties Dielectric constant , εr36.64 ε0 at 20 °C Surface tension 29.29 dyn/cm
Thermodynamic properties Phase behavior Triple point 229.32 K (−43.83 °C), 167 Pa Std entropy change of fusion , ΔfusS o35.61 J/(mol·K) (crystal I → liq) Std entropy change of vaporization , ΔvapS o111.44 J/(mol·K) at 25 °C Solid properties Heat capacity , cp 92.36 J/(mol K)at 298.15 K Std enthalpy change of state transition, ΔtrsH o 0.8979 kJ/mol at −56.2 °C (crystal II → crystal I) Std entropy change of state transition, ΔtrsS o 4.14 J/(mol·K) at −56.2 °C (crystal II → crystal I) Liquid properties Std enthalpy change of formation , ΔfH oliquid−40.56 kJ/mol Standard molar entropy , S oliquid149.62 J/(mol K) Enthalpy of combustion , ΔcH o−1256.33 kJ/mol Heat capacity , cp 91.7 J/(mol K) at 25 °C Gas properties Std enthalpy change of formation , ΔfH ogas−74.04 kJ/mol
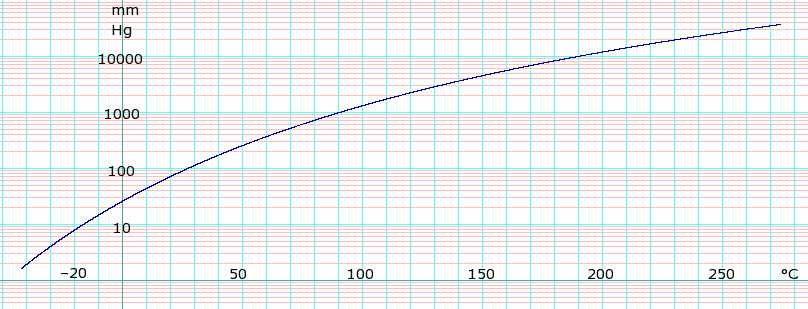
Vapor pressure of liquid P in mm Hg 1 10 40 100 400 760 T in °C −47.0(s) −16.3 7.7 27.0 62.5 81.8
Table data obtained from CRC Handbook of Chemistry and Physics , 44th ed. The "(s)" notation indicates temperature of solid/vapor equilibrium. Otherwise the data is temperature of liquid/vapor equilibrium.
log10 of Acetonitrile vapor pressure. Uses formula log e P m m H g = {\displaystyle \scriptstyle \log _{e}P_{mmHg}=}log e ( 760 101.325 ) − 3.881710 log e ( T + 273.15 ) − 4999.618 T + 273.15 + 41.05901 + 3.515956 × 10 − 06 ( T + 273.15 ) 2 {\displaystyle \scriptstyle \log _{e}({\frac {760}{101.325}})-3.881710\log _{e}(T+273.15)-{\frac {4999.618}{T+273.15}}+41.05901+3.515956\times 10^{-06}(T+273.15)^{2}} obtained from CHERICDistillation data BP Temp. °C % by mole acetonitrile Vapor-liquid Equilibrium for Acetonitrile/Water P = 760 mmHg BP Temp. °C % by mole acetonitrile liquid vapor 86.5 2.9 26.3 81.1 9.3 50.5 80.0 14.2 55.9 78.6 25.4 61.7 77.4 40.2 65.5 76.7 50.7 66.4 76.6 52.7 67.3 76.0 71.8 72.8 76.6 83.9 78.0 76.8 85.6 76.1 80.4 98.6 94.5Vapor-liquid Equilibrium for Acetonitrile/Methanol P = 760 mmHg BP Temp. °C % by mole methanol liquid vapor 79.20 2.5 9.5 77.95 4.0 13.5 76.77 5.5 17.5 75.12 9.7 26.5 73.12 14.0 33.0 72.07 17.0 37.5 70.96 20.0 420 68.85 24.7 45.5 68.39 28.9 50.5 66.00 41.5 59.5 65.35 47.0 62.5 64.75 54.5 65.5 64.34 63.0 71.5 64.03 69.0 74.5 63.80 74.5 78.9 63.77 82.5 82.5 63.76 86.0 86.0 63.87 90.0 88.0 64.05 93.0 91.5 64.18 95.0 93.0 64.40 97.0 95.5Vapor-liquid Equilibrium for Acetonitrile/Benzene P = 760 mmHg BP Temp. °C % by mole benzene liquid vapor 80.6 2.0 4.8 80.4 2.7 6.2 79.0 5.6 12.5 78.5 6.5 14.7 78.0 7.7 16.5 76.0 17.6 29.3 74.9 24.2 35.5 74.4 29.9 39.3 73.8 37.1 43.8 73.7 38.0 44.9 73.4 44.0 48.5 73.2 51.3 51.9 73.0 52.94 52.94 73.2 58.1 54.5 73.4 66.5 60.0 73.8 71.3 62.6 74.0 76.7 65.7 74.4 79.0 68.0 76.3 92.0 80.1Vapor-liquid Equilibrium for Acetonitrile/Toluene P = 760 mmHg BP Temp. °C % by mole toluene liquid vapor 81.5 3.3 5.1 81.4 6.9 8.1 81.1 12.18 12.18 81.3 18.2 15.4 81.4 22.1 17.2 81.8 28.4 19.5 82.7 37.5 23.0 84.4 53.3 28.4 85.6 60.5 31.5 91.1 78.5 41.7 93.4 84.0 47.3 95.6 87.6 52.6 101.2 92.9 66.5 103.6 95.6 73.8 106.7 97.7 83.6 107.5 98.2 85.4Vapor-liquid Equilibrium for Acetonitrile/Water P = 760 mmHgliquid vapor 86.5 2.9 26.3 81.1 9.3 50.5 80.0 14.2 55.9 78.6 25.4 61.7 77.4 40.2 65.5 76.7 50.7 66.4 76.6 52.7 67.3 76.0 71.8 72.8 76.6 83.9 78.0 76.8 85.6 76.1 80.4 98.6 94.5 Vapor-liquid Equilibrium for Acetonitrile/Methanol P = 760 mmHgBP Temp. °C % by mole methanol liquid vapor 79.20 2.5 9.5 77.95 4.0 13.5 76.77 5.5 17.5 75.12 9.7 26.5 73.12 14.0 33.0 72.07 17.0 37.5 70.96 20.0 420 68.85 24.7 45.5 68.39 28.9 50.5 66.00 41.5 59.5 65.35 47.0 62.5 64.75 54.5 65.5 64.34 63.0 71.5 64.03 69.0 74.5 63.80 74.5 78.9 63.77 82.5 82.5 63.76 86.0 86.0 63.87 90.0 88.0 64.05 93.0 91.5 64.18 95.0 93.0 64.40 97.0 95.5 Vapor-liquid Equilibrium for Acetonitrile/Benzene P = 760 mmHgBP Temp. °C % by mole benzene liquid vapor 80.6 2.0 4.8 80.4 2.7 6.2 79.0 5.6 12.5 78.5 6.5 14.7 78.0 7.7 16.5 76.0 17.6 29.3 74.9 24.2 35.5 74.4 29.9 39.3 73.8 37.1 43.8 73.7 38.0 44.9 73.4 44.0 48.5 73.2 51.3 51.9 73.0 52.94 52.94 73.2 58.1 54.5 73.4 66.5 60.0 73.8 71.3 62.6 74.0 76.7 65.7 74.4 79.0 68.0 76.3 92.0 80.1 Vapor-liquid Equilibrium for Acetonitrile/Toluene P = 760 mmHgBP Temp. °C % by mole toluene liquid vapor 81.5 3.3 5.1 81.4 6.9 8.1 81.1 12.18 12.18 81.3 18.2 15.4 81.4 22.1 17.2 81.8 28.4 19.5 82.7 37.5 23.0 84.4 53.3 28.4 85.6 60.5 31.5 91.1 78.5 41.7 93.4 84.0 47.3 95.6 87.6 52.6 101.2 92.9 66.5 103.6 95.6 73.8 106.7 97.7 83.6 107.5 98.2 85.4
Spectral data UV-Vis λmax ? nm Extinction coefficient , ε? IR Major absorption bands (liquid film) Wave number transmittance 3675 cm−1 79% 3544 cm−1 81% 3202 cm−1 77% 3164 cm−1 60% 3003 cm−1 52% 2944 cm−1 52% 2629 cm−1 81% 2410 cm−1 81% 2293 cm−1 44% 2254 cm−1 4% 1445 cm−1 30% 1378 cm−1 25% 1181 cm−1 84% 1040 cm−1 43% 918 cm−1 47% 750 cm−1 70% (liquid film) Wave number transmittance 3675 cm−1 79% 3544 cm−1 81% 3202 cm−1 77% 3164 cm−1 60% 3003 cm−1 52% 2944 cm−1 52% 2629 cm−1 81% 2410 cm−1 81% 2293 cm−1 44% 2254 cm−1 4% 1445 cm−1 30% 1378 cm−1 25% 1181 cm−1 84% 1040 cm−1 43% 918 cm−1 47% 750 cm−1 70% NMR Proton NMR Carbon-13 NMR Other NMR data MS Masses of main fragments
Linstrom, Peter (1997). . National Institute of Standards and Technology. doi :. from the original on 23 May 2007. Except where noted otherwise, data relate to Standard temperature and pressure . Reliability of data general note.