Arenac County, Michigan
In-game article clicks load inline without leaving the challenge.
Arenac County (/ˈɛərənæk/ AIR-ə-nak) is a county located in the U.S. state of Michigan. As of the 2020 Census, the population was 15,002. The county seat is Standish.
History
Arenac County was created by the Michigan Territory on 2 March 1831, then attached on 2 March 1836 to Saginaw County for administration. The creation and organization of Bay County overlaid Arenac and annexed portions of Saginaw and Midland Counties, causing the legal elimination of Arenac County on 20 April 1857. On 21 April 1883 Arenac County was re-created from the then existing northern townships of Bay County, with somewhat different boundaries than its previous creation. The name Arenac, coined by Henry Rowe Schoolcraft, a US Indian Agent and ethnologist, is a derivation of the Latin arena and the Native American ac. The combined words mean “A sandy place for a good footing.”
The county includes some off-reservation trust lands held by the federal government for the federally recognized Saginaw Chippewa Tribal Nation, which is based in Isabella County. In early 2007, plans were confirmed for a casino to be constructed outside of the city of Standish with a scheduled opening by the end of the year. It is owned and operated by the Saginaw Chippewa Tribe. The Saganing Eagles Landing Casino grand opening was held on January 24, 2008.
Geography
According to the U.S. Census Bureau, the county has a total area of 681 square miles (1,760 km2), of which 363 square miles (940 km2) is land and 317 square miles (820 km2) (47%) is water. It is the third-smallest county in Michigan by land area. Arenac County can be considered a part of either Northern Michigan or Central Michigan.
Geographic features
- Saginaw Bay on Lake Huron
- Au Gres River
- Rifle River
- Pine River (Arenac County)
Major highways
Adjacent counties
By land
- Iosco County (northeast)
- Bay County (south)
- Gladwin County (west)
- Ogemaw County (northwest)
By water
- Tuscola County (south)
- Huron County (southeast)
National protected area
Demographics
| Census | Pop. | Note | %± |
|---|---|---|---|
| 1890 | 5,683 | — | |
| 1900 | 9,821 | 72.8% | |
| 1910 | 9,640 | −1.8% | |
| 1920 | 9,460 | −1.9% | |
| 1930 | 8,007 | −15.4% | |
| 1940 | 9,233 | 15.3% | |
| 1950 | 9,644 | 4.5% | |
| 1960 | 9,860 | 2.2% | |
| 1970 | 11,149 | 13.1% | |
| 1980 | 14,706 | 31.9% | |
| 1990 | 14,931 | 1.5% | |
| 2000 | 17,269 | 15.7% | |
| 2010 | 15,899 | −7.9% | |
| 2020 | 15,002 | −5.6% | |
| 2025 (est.) | 15,068 | 0.4% | |
| US Decennial Census 1790-1960 1900-1990 1990-2000 2010-2018 |

2020 census
As of the 2020 census, the county had a population of 15,002. The median age was 50.6 years. 17.8% of residents were under the age of 18 and 26.3% of residents were 65 years of age or older. For every 100 females there were 102.5 males, and for every 100 females age 18 and over there were 100.7 males age 18 and over.
The racial makeup of the county was 93.4% White, 0.2% Black or African American, 0.9% American Indian and Alaska Native, 0.3% Asian, <0.1% Native Hawaiian and Pacific Islander, 0.5% from some other race, and 4.7% from two or more races. Hispanic or Latino residents of any race comprised 1.8% of the population.
12.5% of residents lived in urban areas, while 87.5% lived in rural areas.
There were 6,631 households in the county, of which 22.2% had children under the age of 18 living in them. Of all households, 49.2% were married-couple households, 20.8% were households with a male householder and no spouse or partner present, and 22.3% were households with a female householder and no spouse or partner present. About 30.7% of all households were made up of individuals and 16.0% had someone living alone who was 65 years of age or older.
There were 9,504 housing units, of which 30.2% were vacant. Among occupied housing units, 83.6% were owner-occupied and 16.4% were renter-occupied. The homeowner vacancy rate was 1.4% and the rental vacancy rate was 6.1%.
2000 census
As of the 2000 United States census, there were 17,269 people, 6,710 households, and 4,717 families in the county. The population density was 47 people per square mile (18 people/km2). There were 9,563 housing units at an average density of 26 per square mile (10/km2). The racial makeup of the county was 95.38% White, 1.82% Black or African American, 0.95% Native American, 0.29% Asian, 0.01% Pacific Islander, 0.21% from other races, and 1.33% from two or more races. 1.38% of the population were Hispanic or Latino of any race. 24.0% were of German, 14.1% Polish, 11.6% French, 10.6% American, 7.9% English, 6.8% Irish and 5.3% French Canadian ancestry. 96.9% spoke English and 1.3% Spanish as their first language.
There were 6,710 households, out of which 29.00% had children under the age of 18 living with them, 57.00% were married couples living together, 9.00% had a female householder with no husband present, and 29.70% were non-families. 25.50% of all households were made up of individuals, and 12.30% had someone living alone who was 65 years of age or older. The average household size was 2.45 and the average family size was 2.92.
The county population contained 23.30% under the age of 18, 7.80% from 18 to 24, 26.80% from 25 to 44, 25.50% from 45 to 64, and 16.60% who were 65 years of age or older. The median age was 40 years. For every 100 females there were 105.40 males. For every 100 females age 18 and over, there were 104.40 males.
The median income for a household in the county was $32,805, and the median income for a family was $39,033. Males had a median income of $31,205 versus $20,363 for females. The per capita income for the county was $16,300. About 11.30% of families and 13.90% of the population were below the poverty line, including 20.70% of those under age 18 and 7.80% of those age 65 or over.
Religion
- The Roman Catholic Diocese of Saginaw is the controlling regional body for the Catholic Church.
- There are no meetinghouses of the Church of Jesus Christ of Latter-day Saints located within Arenac County.
Government
Arenac County could be described as slightly Republican-leaning. Since 1884, the Republican Party nominee has carried the county vote in 56% of the elections (20 of 36 elections). Due to 3 elections won by independent candidates during that period, the Democratic record is only 36% (12 of 36).
In 2024, Donald Trump won nearly 70% of the vote in Arenac County, the largest vote share any candidate has received in the county's history.
| Year | Republican | Democratic | Third party(ies) | |||
|---|---|---|---|---|---|---|
| No. | % | No. | % | No. | % | |
| 1884 | 323 | 31.95% | 607 | 60.04% | 81 | 8.01% |
| 1888 | 357 | 31.85% | 261 | 23.28% | 503 | 44.87% |
| 1892 | 322 | 27.81% | 373 | 32.21% | 463 | 39.98% |
| 1896 | 611 | 37.39% | 997 | 61.02% | 26 | 1.59% |
| 1900 | 972 | 51.02% | 861 | 45.20% | 72 | 3.78% |
| 1904 | 1,372 | 68.77% | 458 | 22.96% | 165 | 8.27% |
| 1908 | 1,081 | 56.19% | 714 | 37.11% | 129 | 6.70% |
| 1912 | 421 | 21.17% | 452 | 22.72% | 1,116 | 56.11% |
| 1916 | 911 | 46.86% | 938 | 48.25% | 95 | 4.89% |
| 1920 | 1,521 | 66.36% | 669 | 29.19% | 102 | 4.45% |
| 1924 | 1,767 | 67.57% | 575 | 21.99% | 273 | 10.44% |
| 1928 | 1,612 | 67.87% | 749 | 31.54% | 14 | 0.59% |
| 1932 | 1,471 | 40.13% | 2,086 | 56.90% | 109 | 2.97% |
| 1936 | 1,505 | 43.50% | 1,761 | 50.90% | 194 | 5.61% |
| 1940 | 2,293 | 60.23% | 1,499 | 39.37% | 15 | 0.39% |
| 1944 | 1,978 | 60.47% | 1,280 | 39.13% | 13 | 0.40% |
| 1948 | 1,790 | 58.86% | 1,203 | 39.56% | 48 | 1.58% |
| 1952 | 2,753 | 67.74% | 1,290 | 31.74% | 21 | 0.52% |
| 1956 | 2,631 | 63.32% | 1,520 | 36.58% | 4 | 0.10% |
| 1960 | 2,352 | 55.34% | 1,888 | 44.42% | 10 | 0.24% |
| 1964 | 1,413 | 36.68% | 2,436 | 63.24% | 3 | 0.08% |
| 1968 | 2,089 | 52.37% | 1,573 | 39.43% | 327 | 8.20% |
| 1972 | 2,588 | 57.43% | 1,829 | 40.59% | 89 | 1.98% |
| 1976 | 2,687 | 49.55% | 2,695 | 49.70% | 41 | 0.76% |
| 1980 | 3,436 | 53.43% | 2,547 | 39.61% | 448 | 6.97% |
| 1984 | 3,483 | 58.63% | 2,436 | 41.00% | 22 | 0.37% |
| 1988 | 3,064 | 48.63% | 3,211 | 50.97% | 25 | 0.40% |
| 1992 | 2,330 | 32.33% | 3,244 | 45.02% | 1,632 | 22.65% |
| 1996 | 2,247 | 34.09% | 3,472 | 52.68% | 872 | 13.23% |
| 2000 | 3,421 | 47.08% | 3,685 | 50.71% | 161 | 2.22% |
| 2004 | 4,071 | 49.55% | 4,076 | 49.61% | 69 | 0.84% |
| 2008 | 3,807 | 46.84% | 4,155 | 51.12% | 166 | 2.04% |
| 2012 | 4,057 | 51.74% | 3,669 | 46.79% | 115 | 1.47% |
| 2016 | 4,950 | 64.04% | 2,384 | 30.84% | 395 | 5.11% |
| 2020 | 5,928 | 67.07% | 2,774 | 31.38% | 137 | 1.55% |
| 2024 | 6,379 | 69.62% | 2,662 | 29.05% | 122 | 1.33% |
| Year | Republican | Democratic | Third party(ies) | |||
|---|---|---|---|---|---|---|
| No. | % | No. | % | No. | % | |
| 2024 | 5,911 | 66.13% | 2,786 | 31.17% | 241 | 2.70% |
| Year | Republican | Democratic | Third party(ies) | |||
|---|---|---|---|---|---|---|
| No. | % | No. | % | No. | % | |
| 2022 | 4,314 | 60.17% | 2,709 | 37.78% | 147 | 2.05% |
The county government operates the jail, maintains rural roads, operates the major local courts, records deeds, mortgages, and vital records, administers public health regulations, and participates with the state in the provision of social services. The county board of commissioners controls the budget and has limited authority to make laws or ordinances. In Michigan, most local government functions — police and fire, building and zoning, tax assessment, street maintenance, etc. — are the responsibility of individual cities and townships.
Elected officials
- Prosecuting Attorney: Curtis Broughton
- Sheriff: Jim Mosciski
- County Clerk: Ricky R. Rockwell
- County Treasurer: Dennis Stawowy
- Register of Deeds: Darlene Mikkola
- Drain Commissioner: Jeff Trombley
- Road Commissioners: Blair Dyer-Superintendent; Ken Stawowy-V. Chair; Lewis Ostrander; Olen Swartz-Chair
(information as of March 2009)
Communities
Cities
Villages
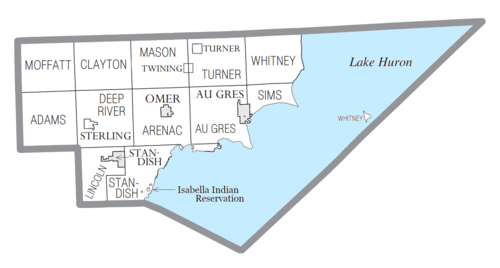
Civil townships
- Adams Township
- Arenac Township
- Au Gres Township
- Clayton Township
- Deep River Township
- Lincoln Township
- Mason Township
- Moffatt Township
- Sims Township
- Standish Township
- Turner Township
- Whitney Township
Unincorporated communities
Indian reservation
- Arenac County contains off-reservation trust land belonging to the Isabella Indian Reservation. They occupy three small parcels of land located within Standish Township.
Events
- Sunrise Side Heritage Bike Ride, first weekend in September. Ride Along Lake Huron Shoreline (US 23) from the Arenac County fairgrounds to Mackinac Bridge then South to West Branch on M-33 and M-55 . This is a 400-mile long organized ride.
See also
- List of Michigan State Historic Sites in Arenac County, Michigan
- National Register of Historic Places listings in Arenac County, Michigan
- USS Arenac (APA-128)
Further reading
- Romig, Walter (1986) [1973]. Michigan Place Names: The History of the Founding and the Naming of More than Five Thousand Past and Present Michigan Communities. Great Lakes Books. Detroit: Wayne State University Press. ISBN 978-0814318386.
External links
44°03′N 83°45′W/44.05°N 83.75°W/ 44.05; -83.75