This page provides supplementary chemical data on chloroform .
Material Safety Data Sheet The handling of this chemical may incur notable safety precautions. It is highly recommend that you seek the Safety Data Sheet (SDS ) for this chemical from a reliable source and follow its directions.
Structure and properties Structure and properties Index of refraction , n D1.4459 at 19 °C Abbe number ? Dielectric constant , εr4.8069 ε0 at 20 °C Bond strength ? Bond length C-Cl 1.75 Å Bond angle Cl-C-Cl 110.3° Dipole moment 1.08 D (gas)[citation needed ] 1.04 D Magnetic susceptibility ? – Close to that of Teflon Surface tension 28.5 dyn/cm at 10 °C 27.1 dyn/cm at 20 °C 26.67 dyn/cm at 25 °C 23.44 dyn/cm at 50 °C 21.7 dyn/cm at 60 °C 20.20 dyn/cm at 75 °C Viscosity 0.786 mPa·s at –10 °C 0.699 mPa·s at 0 °C 0.563 mPa·s at 20 °C 0.542 mPa·s at 25 °C 0.464 mPa·s at 40 °C 0.389 mPa·s at 60 °C
Thermodynamic properties Phase behavior Triple point 209.61 K (–63.54 °C), ? Pa Critical point 537 K (264 °C), 5328.68 kPa Std enthalpy change of fusion , ΔfusH o8.8 kJ/mol Std entropy change of fusion , ΔfusS o42 J/(mol·K) Std enthalpy change of vaporization , ΔvapH o31.4 kJ/mol Std entropy change of vaporization , ΔvapS o105.3 J/(mol·K) Solid properties Std enthalpy change of formation , ΔfH osolid? kJ/mol Standard molar entropy , S osolid? J/(mol K) Heat capacity , cp ? J/(mol K) Liquid properties Std enthalpy change of formation , ΔfH oliquid–134.3 kJ/mol Standard molar entropy , S oliquid? J/(mol K) Enthalpy of combustion –473.2 kJ/mol ΔcH o Heat capacity , cp 114.25 J/(mol K) Gas properties Std enthalpy change of formation , ΔfH ogas–103.18 kJ/mol Standard molar entropy , S ogas295.6 J/(mol K) at 25 °C Heat capacity , cp 65.33 J/(mol K) at 25 °C van der Waals' constants a = 1537 L2 kPa/mol2 b = 0.1022 liter per mole
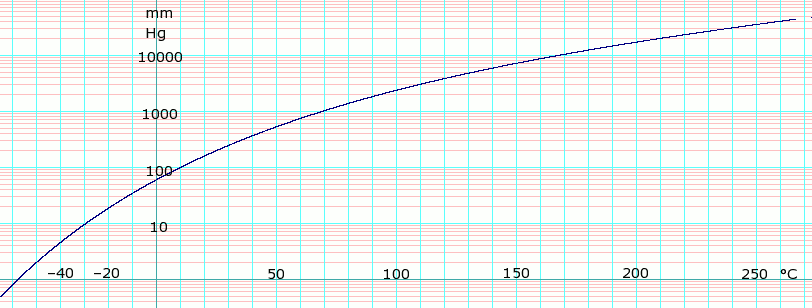
Vapor pressure of liquid P in mm Hg 1 10 40 100 400 760 1520 3800 7600 15200 30400 45600 T in °C –58.0 –29.7 –7.1 10.4 42.7 61.3 83.9 120.0 152.3 191.8 237.5 —
Table data obtained from CRC Handbook of Chemistry and Physics 44th ed.
log10 of Chloroform vapor pressure. Uses formula: log e P m m H g = {\displaystyle \scriptstyle \log _{e}P_{mmHg}=}log e ( 760 101.325 ) − 10.07089 log e ( T + 273.15 ) − 6351.140 T + 273.15 + 81.14393 + 9.127608 × 10 − 6 ( T + 273.15 ) 2 {\displaystyle \scriptstyle \log _{e}({\frac {760}{101.325}})-10.07089\log _{e}(T+273.15)-{\frac {6351.140}{T+273.15}}+81.14393+9.127608\times 10^{-6}(T+273.15)^{2}} obtained from CHERICDistillation data BP Temp. °C % by mole chloroform Vapor-liquid Equilibrium for Chloroform/Ethanol P = 101.325 kPa BP Temp. °C % by mole chloroform liquid vapor 78.15 0.0 0.0 78.07 0.52 1.59 77.83 1.02 3.01 76.81 2.21 7.45 74.90 5.80 17.10 74.39 6.72 19.40 73.55 8.38 23.31 72.85 10.57 28.05 72.24 11.80 30.52 71.58 13.18 33.13 69.72 17.65 41.00 68.95 19.62 43.66 68.58 20.71 45.43 67.35 23.86 49.77 65.89 28.54 55.09 64.87 32.35 58.48 63.88 36.07 61.27 63.23 39.34 64.50 62.61 41.38 65.49 62.17 44.41 67.57 61.48 49.97 71.11 61.00 53.92 72.91 60.49 54.76 73.57 60.35 59.65 74.68 60.30 61.60 75.53 60.20 63.04 76.12 60.09 64.48 76.69 59.97 66.90 77.74 59.54 72.01 79.33 59.32 79.07 82.62 59.26 82.99 83.59 59.28 84.97 84.69 59.31 85.96 85.24 59.46 89.92 87.93 59.72 91.10 88.73 59.70 92.44 89.79 59.84 93.90 91.02 59.91 95.26 92.56 60.18 96.13 93.58 60.88 98.89 97.93 61.13 100.00 100.00Vapor-liquid Equilibrium for Chloroform/Acetone P = 101.325 kPa BP Temp. °C % by mole acetone liquid vapor 62.11 7.5 4.9 63.45 17.7 13.7 63.95 22.9 19.1 64.19 26.2 23.0 64.29 28.5 25.9 64.45 34.5 33.9 64.47 35.7 35.6 64.47 36.5 36.6 64.46 38.7 39.6 64.43 39.5 40.8 64.40 40.4 42.0 64.20 45.2 48.8 64.05 46.6 51.0 64.04 47.4 52.0 63.67 51.9 57.9 63.19 56.4 64.1 62.73 59.4 67.9 62.42 61.0 69.7 62.16 62.4 71.5 61.24 68.4 78.0 60.23 74.7 84.0 57.23 91.8 96.1Vapor-liquid Equilibrium for Chloroform/Methanol P = 760 mm Hg BP Temp. °C % by mole chloroform liquid vapor 63 4.0 10.2 62 6.5 15.4 60.9 9.5 21.5 59.3 14.6 30.4 57.8 19.6 37.8 57.0 23.0 42.0 55.9 28.7 47.2 55.3 33.2 50.7 54.7 38.3 54.0 54.3 42.5 56.4 54.0 45.9 58.0 53.8 52.0 60.7 53.7 55.7 61.9 53.5 62.8 64.3 53.5 63.6 64.6 53.5 66.7 65.5 53.7 75.3 68.4 53.9 79.7 70.1 54.4 85.5 73.0 55.2 90.4 76.8 56.3 93.7 81.2 57.9 97.0 87.5Vapor-liquid Equilibrium for Chloroform/Ethanol P = 101.325 kPaliquid vapor 78.15 0.0 0.0 78.07 0.52 1.59 77.83 1.02 3.01 76.81 2.21 7.45 74.90 5.80 17.10 74.39 6.72 19.40 73.55 8.38 23.31 72.85 10.57 28.05 72.24 11.80 30.52 71.58 13.18 33.13 69.72 17.65 41.00 68.95 19.62 43.66 68.58 20.71 45.43 67.35 23.86 49.77 65.89 28.54 55.09 64.87 32.35 58.48 63.88 36.07 61.27 63.23 39.34 64.50 62.61 41.38 65.49 62.17 44.41 67.57 61.48 49.97 71.11 61.00 53.92 72.91 60.49 54.76 73.57 60.35 59.65 74.68 60.30 61.60 75.53 60.20 63.04 76.12 60.09 64.48 76.69 59.97 66.90 77.74 59.54 72.01 79.33 59.32 79.07 82.62 59.26 82.99 83.59 59.28 84.97 84.69 59.31 85.96 85.24 59.46 89.92 87.93 59.72 91.10 88.73 59.70 92.44 89.79 59.84 93.90 91.02 59.91 95.26 92.56 60.18 96.13 93.58 60.88 98.89 97.93 61.13 100.00 100.00 Vapor-liquid Equilibrium for Chloroform/Acetone P = 101.325 kPaBP Temp. °C % by mole acetone liquid vapor 62.11 7.5 4.9 63.45 17.7 13.7 63.95 22.9 19.1 64.19 26.2 23.0 64.29 28.5 25.9 64.45 34.5 33.9 64.47 35.7 35.6 64.47 36.5 36.6 64.46 38.7 39.6 64.43 39.5 40.8 64.40 40.4 42.0 64.20 45.2 48.8 64.05 46.6 51.0 64.04 47.4 52.0 63.67 51.9 57.9 63.19 56.4 64.1 62.73 59.4 67.9 62.42 61.0 69.7 62.16 62.4 71.5 61.24 68.4 78.0 60.23 74.7 84.0 57.23 91.8 96.1 Vapor-liquid Equilibrium for Chloroform/Methanol P = 760 mm HgBP Temp. °C % by mole chloroform liquid vapor 63 4.0 10.2 62 6.5 15.4 60.9 9.5 21.5 59.3 14.6 30.4 57.8 19.6 37.8 57.0 23.0 42.0 55.9 28.7 47.2 55.3 33.2 50.7 54.7 38.3 54.0 54.3 42.5 56.4 54.0 45.9 58.0 53.8 52.0 60.7 53.7 55.7 61.9 53.5 62.8 64.3 53.5 63.6 64.6 53.5 66.7 65.5 53.7 75.3 68.4 53.9 79.7 70.1 54.4 85.5 73.0 55.2 90.4 76.8 56.3 93.7 81.2 57.9 97.0 87.5
Spectral data UV-Vis λmax ? nm Extinction coefficient , ε? IR Major absorption bands 1215, 761, 668 cm−1 NMR Proton NMR δ CDCl3 7.26 (s, 1H) Carbon-13 NMR δ CDCl3 77.2 Other NMR data MS Masses of main fragments
Linstrom, Peter (1997). . National Institute of Standards and Technology. doi :. {{cite journal}}:Cite journal requires |journal= (help)Except where noted otherwise, data relate to Standard temperature and pressure . Reliability of data general note.