Demographics of England
In-game article clicks load inline without leaving the challenge.


The demographics of England have been measured by the decennial national census since 1801, and are marked by centuries of population growth and urbanization. Due to the lack of authoritative contemporary sources, estimates of the population of England for dates prior to the first census in 1801 vary considerably. The population of England at the 2021 census was about 56,489,800.
Population
The population of England in 2021 was estimated to be 56,489,800. This is the most recent census. In the previous census, in 2011, the population was 53,012,456.
Data for the 2021 census:
- Female: 28,833,712
- Male: 27,656,336
- Total population: 56,489,800
- Total Fertility Rate: 1.61 (2021)
Historical population

Domesday population
Russell (1948) states that the fundamental demographic categories of the Domesday Survey in 1086 were broadly similar to that of the Poll Tax Survey of 1377. These were:
There was a recorded 740 monks, 200 nuns and 4500 secular clergy in 1086. The counties of Cheshire, Cumberland, Durham, Lancashire, Northumberland, Westmorland, Yorkshire all had different boundaries to their modern namesakes and had uncharacteristically low populations due to the Harrying of the North.
| County | Landed group | Burghal group | Total |
| Bedfordshire | 13,562 | 420 | 13,982 |
| Berkshire | 22,082 | 2,558 | 24,640 |
| Buckinghamshire | 18,879 | 560 | 19,439 |
| Cambridgeshire | 18,098 | 1,960 | 20,058 |
| Cornwall | 19,033 | 19,033 | |
| Derbyshire | 9,982 | 490 | 10,472 |
| Devon | 60,095 | 2,562 | 62,657 |
| Dorset | 26,736 | 3,152 | 29,888 |
| Essex | 53,991 | 2,082 | 56,073 |
| Gloucestershire | 28,749 | 5,138 | 33,877 |
| Hampshire | 35,312 | 7,032 | 42,344 |
| Herefordshire | 18,543 | 1,991 | 20,534 |
| Hertfordshire | 14,388 | 1,558 | 15,946 |
| Huntingdonshire | 8,998 | 1,316 | 10,314 |
| Kent | 40,348 | 8,238 | 48,586 |
| Leicestershire | 23,320 | 1,278 | 24,598 |
| Lincolnshire | 83,384 | 6,957 | 90,341 |
| Middlesex | 7,833 | 17,850 | 25,683 |
| Norfolk | 87,437 | 8,001 | 95,438 |
| Northamptonshire | 29,008 | 1,032 | 30,040 |
| Nottinghamshire | 19,040 | 1,190 | 20,230 |
| Oxfordshire | 23,706 | 1,431 | 25,137 |
| Rutland | 2,992 | 2,992 | |
| Shropshire | 17,056- | 922 | 17,978 |
| Somerset | 46,473 | 3,811 | 50,284 |
| Staffordshire | 10,874 | 746 | 11,620 |
| Suffolk | 68,870 | 4,248 | 73,118 |
| Surrey | 14,728 | 1,197 | 15,925 |
| Sussex | 35,490 | 7,133 | 42,623 |
| Warwickshire | 22,631 | 1,284 | 23,915 |
| Wiltshire | 34,489 | 6,416 | 40,905 |
| Worcestershire | 15,449 | 1,550 | 16,999 |
| Cheshire | 4,038 | 2,142 | 6,180 |
| Cumberland | 5,971 | 5,971 | |
| Durham | 3,983 | 1,000 | 4,983 |
| Lancashire | 7,385 | 7,385 | |
| Northumberland | 7,927 | 7,927 | |
| Westmorland | 3,098 | 3,098 | |
| Yorkshire | 23,827 | 4,726 | 28,553 |
| Total | 987,805 | 111,971 | 1,099,766 |
Russell (1948) therefore calculates a total English population in 1086 as 1,105,216 including burgesses, landowners and clergy. To this he adds estimates of Wales (100,000), Ireland (400,000) and Scotland (120,000) for a total British Isles population of roughly 1,720,000.
| Year | Pop. | ±% |
|---|---|---|
| Population 5000–100 BCYearPop.±%50000BCbelow 6000—30000BC100,000—18000BC300,000+200.0%01000BC1,500,000+400.0%Source: | Population 1086–1700YearPop.±% p.a.10861,710,000—11903,100,000+0.57%12203,970,000+0.83%12504,230,000+0.21%12794,430,000+0.16%12904,750,000+0.64%13154,690,000−0.05%13254,120,000−1.29%13484,810,000+0.68%13512,600,000−18.54%13772,500,000−0.15%14002,080,000−0.80%14302,020,000−0.10%14501,900,000−0.31%14902,140,000+0.30%15222,350,000+0.29%15412,830,000+0.98%15603,020,000+0.34%16004,110,000+0.77%16505,310,000+0.51%17005,200,000−0.04%Source: | Population 1801–2023YearPop.±%18018,287,907—18119,405,342+13.5%182111,178,050+18.8%183112,976,329+16.1%184114,847,888+14.4%185116,738,495+12.7%186118,753,390+12.0%187121,361,235+13.9%188124,397,385+14.2%189127,231,229+11.6%190130,072,180+10.4%191133,561,235+11.6%192135,230,225+5.0%193137,359,045+6.0%193938,084,321+1.9%195141,164,356+8.1%196143,460,525+5.6%197146,411,700+6.8%198146,820,800+0.9%199147,875,000+2.3%200149,138,831+2.6%201153,012,456+7.9%202156,489,800+6.6%202357,690,300+2.1%Source: Year(s) 1801–2011 |
| 50000BC | below 6000 | — |
| 30000BC | 100,000 | — |
| 18000BC | 300,000 | +200.0% |
| 01000BC | 1,500,000 | +400.0% |
| Source: | ||
| Year | Pop. | ±% p.a. |
| 1086 | 1,710,000 | — |
| 1190 | 3,100,000 | +0.57% |
| 1220 | 3,970,000 | +0.83% |
| 1250 | 4,230,000 | +0.21% |
| 1279 | 4,430,000 | +0.16% |
| 1290 | 4,750,000 | +0.64% |
| 1315 | 4,690,000 | −0.05% |
| 1325 | 4,120,000 | −1.29% |
| 1348 | 4,810,000 | +0.68% |
| 1351 | 2,600,000 | −18.54% |
| 1377 | 2,500,000 | −0.15% |
| 1400 | 2,080,000 | −0.80% |
| 1430 | 2,020,000 | −0.10% |
| 1450 | 1,900,000 | −0.31% |
| 1490 | 2,140,000 | +0.30% |
| 1522 | 2,350,000 | +0.29% |
| 1541 | 2,830,000 | +0.98% |
| 1560 | 3,020,000 | +0.34% |
| 1600 | 4,110,000 | +0.77% |
| 1650 | 5,310,000 | +0.51% |
| 1700 | 5,200,000 | −0.04% |
| Source: | ||
| Year | Pop. | ±% |
| 1801 | 8,287,907 | — |
| 1811 | 9,405,342 | +13.5% |
| 1821 | 11,178,050 | +18.8% |
| 1831 | 12,976,329 | +16.1% |
| 1841 | 14,847,888 | +14.4% |
| 1851 | 16,738,495 | +12.7% |
| 1861 | 18,753,390 | +12.0% |
| 1871 | 21,361,235 | +13.9% |
| 1881 | 24,397,385 | +14.2% |
| 1891 | 27,231,229 | +11.6% |
| 1901 | 30,072,180 | +10.4% |
| 1911 | 33,561,235 | +11.6% |
| 1921 | 35,230,225 | +5.0% |
| 1931 | 37,359,045 | +6.0% |
| 1939 | 38,084,321 | +1.9% |
| 1951 | 41,164,356 | +8.1% |
| 1961 | 43,460,525 | +5.6% |
| 1971 | 46,411,700 | +6.8% |
| 1981 | 46,820,800 | +0.9% |
| 1991 | 47,875,000 | +2.3% |
| 2001 | 49,138,831 | +2.6% |
| 2011 | 53,012,456 | +7.9% |
| 2021 | 56,489,800 | +6.6% |
| 2023 | 57,690,300 | +2.1% |
| Source: Year(s) 1801–2011 |
Vital statistics
This is UK wide information.
| Average population | Live births | Deaths | Natural change | Crude birth rate (per 1000) | Crude death rate (per 1000) | Natural change (per 1000) | Fertility rates | |
|---|---|---|---|---|---|---|---|---|
| 1940 | 567,710 | 545,952 | 21,758 | 14.1 | 13.6 | 0.5 | ||
| 1941(c) | 539,205 | 499,343 | 39,862 | 13.9 | 12.9 | 1.0 | ||
| 1942 | 608,373 | 448,777 | 159,596 | 15.6 | 11.5 | 4.1 | ||
| 1943 | 641,064 | 469,916 | 171,148 | 16.2 | 11.9 | 4.3 | ||
| 1944 | 704,748 | 461,189 | 243,559 | 17.7 | 11.6 | 6.1 | ||
| 1945 | 638,422 | 456,216 | 182,206 | 15.9 | 11.4 | 4.5 | ||
| 1946 | 773,153 | 460,543 | 312,610 | 19.2 | 11.4 | 7.8 | ||
| 1947 | 829,863 | 484,324 | 345,539 | 20.5 | 12.0 | 8.5 | ||
| 1948 | 728,131 | 439,803 | 288,328 | 17.9 | 10.8 | 7.1 | ||
| 1949 | 686,181 | 478,627 | 207,554 | 16.8 | 11.7 | 5.1 | ||
| 1950 | 654,321 | 477,006 | 177,315 | 15.5 | 11.3 | 4.2 | ||
| 1951(c) | 41,164,356 | 636,259 | 513,375 | 122,884 | 15.5 | 12.5 | 3.0 | |
| 1952 | 632,347 | 466,479 | 165,858 | 15.3 | 11.3 | 4.0 | ||
| 1953 | 642,844 | 472,137 | 170,707 | 15.5 | 11.3 | 4.2 | ||
| 1954 | 633,395 | 469,074 | 164,321 | 15.2 | 11.3 | 3.9 | ||
| 1955 | 628,935 | 484,926 | 144,009 | 15.0 | 11.7 | 3.3 | ||
| 1956 | 659,420 | 488,893 | 170,527 | 15.7 | 11.7 | 4.0 | ||
| 1957 | 681,736 | 482,174 | 199,562 | 16.1 | 11.5 | 4.6 | ||
| 1958 | 698,255 | 494,201 | 204,054 | 16.4 | 11.7 | 4.7 | ||
| 1959 | 706,239 | 495,517 | 210,722 | 16.5 | 11.6 | 4.9 | ||
| 1960 | 740,858 | 493,553 | 247,305 | 17.1 | 11.5 | 5.6 | ||
| 1961(c) | 43,460,525 | 766,358 | 518,047 | 248,311 | 17.6 | 11.9 | 5.7 | |
| 1962 | 793,354 | 523,855 | 269,499 | 18.0 | 12.0 | 6.0 | ||
| 1963 | 807,017 | 538,105 | 268,912 | 18.2 | 12.2 | 6.0 | ||
| 1964 | 828,470 | 501,991 | 326,479 | 18.5 | 11.3 | 7.2 | ||
| 1965 | 816,433 | 516,317 | 300,116 | 18.1 | 11.5 | 6.6 | ||
| 1966 | 804,957 | 528,981 | 275,976 | 17.7 | 11.8 | 5.9 | ||
| 1967 | 788,458 | 509,356 | 279,102 | 17.2 | 11.2 | 6.0 | ||
| 1968 | 775,065 | 541,862 | 233,203 | 16.9 | 11.9 | 5.0 | ||
| 1969 | 754,456 | 543,425 | 211,031 | 16.4 | 11.9 | 4.5 | ||
| 1970 | 741,999 | 540,196 | 201,803 | 16.0 | 11.6 | 4.4 | ||
| 1971(c) | 46,411,700 | 740,099 | 532,445 | 207,654 | 15.9 | 11.5 | 4.4 | |
| 1972 | 46,572,000 | 685,485 | 554,251 | 131,234 | 14.7 | 11.9 | 2.8 | |
| 1973 | 46,686,000 | 638,356 | 549,876 | 88,480 | 13.7 | 11.8 | 1.9 | |
| 1974 | 46,682,000 | 603,153 | 547,980 | 55,173 | 12.9 | 11.7 | 1.2 | |
| 1975 | 46,674,000 | 568,900 | 545,444 | 23,456 | 12.2 | 11.7 | 0.5 | |
| 1976 | 46,659,000 | 550,383 | 560,317 | −9,934 | 11.8 | 12.0 | −0.2 | |
| 1977 | 46,639,000 | 536,953 | 538,652 | −1,699 | 11.5 | 11.5 | −0.0 | |
| 1978 | 46,638,000 | 562,589 | 547,685 | 14,904 | 12.1 | 11.7 | 0.4 | |
| 1979 | 46,698,000 | 601,316 | 554,840 | 46,476 | 12.9 | 11.9 | 1.0 | |
| 1980 | 46,787,000 | 618,371 | 544,349 | 74,022 | 13.2 | 11.6 | 1.6 | |
| 1981(c) | 46,820,800 | 598,163 | 541,018 | 57,145 | 12.8 | 11.6 | 1.2 | |
| 1982 | 46,777,000 | 589,711 | 544,984 | 44,727 | 12.6 | 11.7 | 0.9 | 1.76 |
| 1983 | 46,813,000 | 593,255 | 542,509 | 50,746 | 12.7 | 11.6 | 1.1 | 1.75 |
| 1984 | 46,912,000 | 600,573 | 531,314 | 69,259 | 12.8 | 11.3 | 1.5 | 1.75 |
| 1985 | 47,057,000 | 619,301 | 553,153 | 66,148 | 13.2 | 11.8 | 1.4 | 1.78 |
| 1986 | 47,187,000 | 623,609 | 544,545 | 79,064 | 13.2 | 11.5 | 1.7 | 1.76 |
| 1987 | 47,300,000 | 643,330 | 531,150 | 112,180 | 13.6 | 11.2 | 2.4 | 1.80 |
| 1988 | 47,412,000 | 654,353 | 535,553 | 118,800 | 13.8 | 11.3 | 2.5 | 1.82 |
| 1989 | 47,552,000 | 649,357 | 539,804 | 109,553 | 13.7 | 11.4 | 2.3 | 1.79 |
| 1990 | 47,699,000 | 666,920 | 528,920 | 138,000 | 14.0 | 11.1 | 3.9 | 1.83 |
| 1991(c) | 47,875,000 | 660,806 | 533,980 | 126,826 | 13.8 | 11.2 | 2.6 | 1.81 |
| 1992 | 47,998,000 | 651,784 | 522,660 | 129,124 | 13.6 | 10.9 | 2.7 | 1.79 |
| 1993 | 48,102,000 | 636,473 | 540,904 | 95,569 | 13.2 | 11.2 | 2.0 | 1.76 |
| 1994 | 48,228,000 | 628,956 | 516,297 | 112,659 | 13.0 | 10.7 | 2.3 | 1.75 |
| 1995 | 48,383,000 | 613,257 | 529,038 | 84,219 | 12.7 | 10.9 | 1.8 | 1.71 |
| 1996 | 48,519,000 | 614,184 | 526,650 | 87,534 | 12.7 | 10.9 | 1.8 | 1.73 |
| 1997 | 48,664,000 | 608,202 | 521,598 | 86,604 | 12.5 | 10.7 | 1.8 | 1.73 |
| 1998 | 48,820,000 | 602,111 | 518,089 | 84,022 | 12.3 | 10.6 | 1.7 | 1.72 |
| 1999 | 49,032,000 | 589,468 | 517,119 | 72,349 | 12.0 | 10.5 | 1.5 | 1.69 |
| 2000 | 49,233,000 | 572,826 | 503,026 | 69,800 | 11.6 | 10.2 | 1.4 | 1.65 |
| 2001(c) | 49,449,000 | 563,744 | 497,878 | 65,866 | 11.4 | 10.1 | 1.3 | 1.63 |
| 2002 | 49,679,000 | 565,709 | 500,792 | 64,917 | 11.4 | 10.1 | 1.3 | 1.64 |
| 2003 | 49,925,000 | 589,851 | 504,127 | 85,724 | 11.8 | 10.1 | 1.7 | 1.72 |
| 2004 | 50,194,000 | 607,184 | 480,717 | 126,467 | 12.1 | 9.6 | 2.5 | 1.77 |
| 2005 | 50,606,000 | 613,028 | 479,678 | 133,350 | 12.1 | 9.5 | 2.6 | 1.77 |
| 2006 | 50,965,000 | 635,748 | 470,326 | 165,422 | 12.5 | 9.2 | 3.3 | 1.83 |
| 2007 | 51,381,000 | 655,357 | 470,721 | 184,636 | 12.8 | 9.2 | 3.6 | 1.88 |
| 2008 | 51,815,000 | 672,809 | 475,763 | 197,046 | 13.0 | 9.2 | 3.8 | 1.92 |
| 2009 | 52,196,000 | 671,058 | 459,241 | 211,817 | 12.9 | 8.8 | 4.1 | 1.91 |
| 2010 | 52,642,000 | 687,007 | 461,017 | 225,990 | 13.1 | 8.8 | 4.3 | 1.94 |
| 2011(c) | 53,107,000 | 688,120 | 452,862 | 235,258 | 13.0 | 8.5 | 4.5 | 1.93 |
| 2012 | 53,493,000 | 694,241 | 466,779 | 227,462 | 13.0 | 8.7 | 4.3 | 1.94 |
| 2013 | 53,865,000 | 664,517 | 473,552 | 190,965 | 12.3 | 8.8 | 3.5 | 1.85 |
| 2014 | 54,316,000 | 661,496 | 468,875 | 192,621 | 12.2 | 8.6 | 3.6 | 1.83 |
| 2015 | 54,786,000 | 664,399 | 495,309 | 169,090 | 12.1 | 9.0 | 3.1 | 1.82 |
| 2016 | 55,268,000 | 663,157 | 490,454 | 172,703 | 12.0 | 8.9 | 3.1 | 1.81 |
| 2017 | 55,619,000 | 646,794 | 498,882 | 147,912 | 11.6 | 9.0 | 2.6 | 1.76 |
| 2018 | 55,977,000 | 625,651 | 505,859 | 119,792 | 11.2 | 9.0 | 2.2 | 1.70 |
| 2019 | 56,287,000 | 610,505 | 488,952 | 121,553 | 10.8 | 8.7 | 2.1 | 1.66 |
| 2020 | 56,550,000 | 585,195 | 569,700 | 15,495 | 10.3 | 10.1 | 0.3 | 1.59 |
| 2021(c) | 56,489,800 | 595,948 | 549,207 | 46,741 | 10.5 | 9.7 | 0.8 | 1.56 |
| 2022 | 57,106,398 | 577,046 | 540,333 | 36,713 | 10.2 | 9.5 | 0.7 | 1.49 |
| 2023 | 57,910,000 | 563,561 | 544,032 | 19,529 | 9.8 | 9.4 | 0.4 | 1.44 |
| 2024 | 58,560,000 | 567,708 | 531,953 | 35,755 | 9.7 | 9.1 | 0.6 | 1.42 |
| 2025 | 534,048 |
(c) = Census results.
In 2024, 34.7% of live births were to mothers born outside the UK and for 40.4% of live births, one or both parents were born outside of the UK.
Current vital statistics
The number of registered births and deaths correspond to England and Wales, since the Office for National Statistics provides provisional monthly birth data without distinguishing both countries.
| Period | Live births | Deaths | Natural increase |
|---|---|---|---|
| January—September 2024 | 426,622 | 424,715 | +1,907 |
| January—September 2025 | 419,290 | 426,804 | −7,514 |
| Difference | −7,332 (−1.71%) | +2,089 (+0.49%) | −9,421 |
| Source: |
Historical per cent distribution of the total population by age
| Ages | 1901 | 1931 | 1951 | 1961 |
|---|---|---|---|---|
| 0–14 years | 32 | 24 | 22 | 23 |
| 15–64 years | 63 | 69 | 67 | 65 |
| 65 years and over | 5 | 7 | 11 | 12 |
| Total (%) | 100 | 100 | 100 | 100 |
Country of birth
Country of birth given by respondents in the corresponding UK censuses were as follows:

| Country of birth | 1971 | 1981 | 1991 | 2001 | 2011 | 2021 | ||||||
|---|---|---|---|---|---|---|---|---|---|---|---|---|
| Number | % | Number | % | Number | % | Number | % | Number | % | Number | % | |
| United Kingdom | 41,951,042 | 91.3% | 42,620,882 | 93.1% | 43,506,411 | 92.46% | 44,594,817 | 90.75% | 45,675,317 | 86.16% | 46,687,505 | 82.65% |
| England | 40,374,714 | 87.9% | 41,084,399 | 89.8% | 42,003,211 | 89.3% | 42,968,596 | 87.44% | 44,246,592 | 83.46% | 45,388,724 | 80.35% |
| Scotland | 716,499 | 1.6% | 731,412 | 1.7% | 743,856 | 1.58% | 794,577 | 1.62% | 708,872 | 1.34% | 626,443 | 1.11% |
| Wales | 632,548 | 1.4% | 573,014 | 1.3% | 545,381 | 1.16% | 609,711 | 1.24% | 506,619 | 0.96% | 478,697 | 0.85% |
| Northern Ireland | 227,281 | 0.5% | – | – | 211,133 | 0.45% | 215,124 | 0.44% | 206,735 | 0.39% | 190,541 | 0.34% |
| United Kingdom (not otherwise specified) | – | – | 232,057 | 2,830 | 0.01% | 6,809 | 0.01% | 6,499 | 0.01% | 2,612 | ||
| Europe (non-UK) | 1,217,245 | 2.7% | 1,142,182 | 2.4% | 1,196,524 | 2.5% | 1,450,260 | 2.95% | 2,375,441 | 4.5% | 4,042,538 | 7.16% |
| Republic of Ireland Ireland | 647,429 | 1.4% | 567,021 | 1.3% | 555,805 | 1.18% | 460,287 | 0.94% | 395,182 | 0.75% | 314,674 | 0.56% |
| Channel Islands & Isle of Man | – | – | – | – | 26,303 | 0.06% | 27,550 | 0.06% | 24,653 | 0.05% | ||
| Total born in all EU Member Countries (excluding Ireland) | 569,816 | 1.2% | 340,113 | 0% | 452,092 | 1% | 660,061 | 1.34% | 1,980,259 | 3.73% | 3,236,799 | 5.73% |
| EU Member Countries (joined pre-2001) or EEC Members | – | – | 340,113 | 452,092 | 1% | – | – | 894,908 | 1.69% | 1,263,707 | 2.24% | |
| Germany Germany | – | – | – | – | 193,346 | 0.41% | 233,418 | 0.48% | 262,356 | 0.49% | 252,252 | 0.45% |
| Italy Italy | – | – | – | – | 83,724 | 0.18% | 98,757 | 0.20% | 131,195 | 0.25% | 272,019 | 0.48% |
| France France | – | – | – | – | 49,947 | 0.11% | 87,562 | 0.18% | 127,601 | 0.24% | 152,697 | 0.27% |
| Spain Spain | – | – | – | – | 37,006 | 0.08% | 50,431 | 0.10% | 77,554 | 0.15% | 163,848 | 0.29% |
| Other EU Member Countries (joined post-2001) | – | – | – | – | – | – | – | – | 1,085,351 | 2.04% | 1,973,092 | 3.49% |
| Poland Poland | – | – | – | – | 68,049 | 0.14% | 56,679 | 0.12% | 561,098 | 1.06% | 718,251 | 1.27% |
| Romania Romania | – | – | – | – | 3,762 | 0.01% | 7,077 | 0.01% | 78,192 | 0.15% | 530,320 | 0.94% |
| Other non-EU Europe | – | – | 235,048 | 0.5% | 115,247 | 0.2% | – | – | – | – | 491,065 | 0.87% |
| Turkey Turkey | – | – | – | – | 26,016 | 0.06% | 52,402 | 0.11% | 89,484 | 0.17% | 124,758 | 0.22% |
| Soviet Union | – | – | – | – | 25,235 | 0.05% | 27,250 | 0.06% | – | – | – | – |
| Africa | 148,473 | 0.3% | 278,678 | 0.6% | 456,396 | 1% | 798,218 | 1.62% | 1,290,611 | 2.43% | 1,558,199 | 2.76% |
| South Africa South Africa | – | – | – | – | 21,220 | 0.05% | 129,302 | 0.26% | 186,355 | 0.35% | 211,447 | 0.37% |
| Kenya Kenya | – | – | – | – | 109,610 | 0.23% | 126,119 | 0.26% | 135,966 | 0.26% | 133,416 | 0.24% |
| Nigeria Nigeria | – | – | – | – | 45,873 | 0.10% | 86,370 | 0.18% | 188,690 | 0.36% | 266,877 | 0.47% |
| Middle East and Asia | 522,263 | 1.1% | 727,838 | 1.6% | 1,108,529 | 2.4% | 1,778,296 | 3.62% | 2,529,137 | 4.77% | 3,241,701 | 5.74% |
| India India | 301,862 | 0.7% | 378,721 | 0.9% | 395,563 | 0.84% | 450,493 | 0.92% | 682,274 | 1.29% | 906,962 | 1.61% |
| Pakistan Pakistan | 131,826 | 0.3% | 179,712 | 0.4% | 221,776 | 0.47% | 304,706 | 0.62% | 476,684 | 0.90% | 616,454 | 1.09% |
| Bangladesh Bangladesh | 46,873 | 0.1% | 101,829 | 0.22% | 150,057 | 0.31% | 206,331 | 0.39% | 266,290 | 0.47% | ||
| Sri Lanka Sri Lanka | 15,366 | – | – | 38,145 | 0.08% | 66,330 | 0.13% | 125,917 | 0.24% | 141,861 | 0.25% | |
| Far East | 73,209 | 122,532 | 0.3% | – | – | 360,604 | 0.73% | – | – | – | – | |
| Hong Kong Hong Kong | – | – | – | – | 64,496 | 0.14% | 84,770 | 0.17% | 98,724 | 0.19% | 117,714 | 0.21% |
| China China | – | – | – | – | 21,292 | 0.05% | 47,201 | 0.10% | 146,202 | 0.28% | 176,072 | 0.31% |
| Americas and Caribbean | 292,966 | 0.6% | 291,679 | 0.6% | 481,299 | 1% | – | – | 663,091 | 1.25% | 790,002 | 1.40% |
| United States United States | – | – | – | – | 128,337 | 0.27% | 141,198 | 0.29% | 173,470 | 0.33% | 198,656 | 0.35% |
| Jamaica Jamaica | – | – | – | – | 141,352 | 0.30% | 145,234 | 0.30% | 159,170 | 0.30% | 141,289 | 0.25% |
| Canada Canada | – | – | – | – | 53,195 | 0.11% | 59,356 | 0.12% | 66,320 | 0.13% | 66,847 | 0.12% |
| Antarctica and Oceania | – | – | – | – | 104,141 | 0.2% | – | – | 179,200 | 0.34% | 170,023 | 0.30% |
| Australia Australia | – | – | – | – | 66,279 | 0.14% | 96,437 | 0.20% | 113,592 | 0.21% | 109,963 | 0.19% |
| New Zealand New Zealand | – | – | – | – | 37,862 | 0.08% | 53,466 | 0.11% | 57,076 | 0.11% | 47,842 | 0.08% |
| Other: Old Commonwealth | 119,683 | 0.3% | 133,220 | 0.3% | – | – | – | – | – | – | – | – |
| Other: New Commonwealth | 109,971 | 0.2% | 155,389 | 0.3% | 147,602 | 0.3% | – | – | – | – | – | – |
| Other Countries (non Europe or UK for 2001–2021) | 482,351 | 1% | 421,895 | 0.9% | – | – | 3,093,754 | 6.30% | 4,961,698 | 9.36% | 5,760,008 | 10.20% |
| Total | 45,917,667 | 100% | 45,771,763 | 100% | 47,055,204 | 100% | 49,138,831 | 100.00% | 53,012,456 | 100.00% | 56,490,051 | 100% |
Below are the estimates of the largest foreign-born groups in England according to ONS estimates.
| Country of birth | 2013 | 2014 | 2015 | 2018 |
|---|---|---|---|---|
| India | 698,000 | 748,000 | 751,000 | 832,000 |
| Poland Poland | 561,000 | 677,000 | 713,000 | 832,000 |
| Pakistan | 479,000 | 499,000 | 478,000 | 535,000 |
| Republic of Ireland Ireland | 315,000 | 317,000 | 318,000 | 369,000 |
| Germany Germany | 263,000 | 267,000 | 253,000 | 309,000 |

Age

The data below is based on the 2011 census. In 2001, the mean age of England's population was 38.60, and the median age was 37.00. In 2022, the median age was 40.5.
| Ages attained (years) | Population | ||
|---|---|---|---|
| Numbers | % of total population | ||
| Whole age band | Per year of age band | ||
| 0–4 | 3,318,449 | 6.26 | 1.25 |
| 5–9 | 2,972,632 | 5.61 | 1.12 |
| 10–14 | 3,080,929 | 5.81 | 1.16 |
| 15–19 | 3,340,265 | 6.30 | 1.26 |
| 20–24 | 3,595,321 | 6.78 | 1.36 |
| 25–29 | 3,650,881 | 6.89 | 1.38 |
| 30–34 | 3,509,221 | 6.62 | 1.32 |
| 35–39 | 3,549,116 | 6.69 | 1.34 |
| 40–44 | 3,885,934 | 7.33 | 1.47 |
| 45–49 | 3,879,815 | 7.32 | 1.46 |
| 50–54 | 3,400,095 | 6.41 | 1.28 |
| 55–59 | 2,996,992 | 5.65 | 1.13 |
| 60–64 | 3,172,277 | 5.98 | 1.20 |
| 65–69 | 2,508,154 | 4.73 | 0.95 |
| 70–74 | 2,044,129 | 3.86 | 0.77 |
| 75–79 | 1,669,345 | 3.15 | 0.63 |
| 80–84 | 1,258,773 | 2.37 | 0.47 |
| 85–89 | 776,311 | 1.46 | 0.29 |
| 90+ | 403,817 | 0.76 | – |
- Population pyramids of the regions of England
- South West
- South East
- Greater London
- East of England
- East Midlands
- West Midlands
- Yorkshire and the Humber
- North West
- North East
Ethnicity


| Ethnic group (reported as 'Area of origin') | 1951 | 1961 | 1966 | mid-1968 | ||||||
|---|---|---|---|---|---|---|---|---|---|---|
| Estimates based solely on selected Commonwealth immigrant populations | Total estimated (including estimates of those born in the UK) | |||||||||
| Population | % | Population | % | Population | % | Population | % | Population | % | |
| Selected Commonwealth non-White: Total | 74,500 | 0.17% | 336,000 | 0.72% | 595,000 | 1.27% | 924,000 | 1.96% | 1,123,000 | 2.31% |
| India | 30,800 | 81,400 | 163,600 | 223,000 | – | – | ||||
| Pakistan | 5,000 | 24,900 | 67,700 | 199,700 | – | – | ||||
| Ceylon (Sri Lanka) | 5,800 | 9,000 | 12,900 | 16,100 | – | – | ||||
| West Indies | 15,300 | 171,800 | 267,900 | – | – | – | – | |||
| Jamaica | – | – | – | – | – | – | 278,000 | – | – | |
| Other Caribbean | – | – | – | – | – | – | 180,300 | – | – | |
| British West Africa (Gambia, Ghana, Nigeria and Sierra Leone) | 5,600 | 19,800 | 36,000 | 50,700 | – | – | ||||
| Far East (Hong Kong, Malaya, Singapore) | 12,000 | 29,600 | 47,000 | 60,000 | – | – | ||||
| Total population | 43,758,000 | 100% | 46,105,000 | 100% | 47,135,500 | 100% | 47,135,500 | 100% | 48,640,000 | 100% |
| Ethnic group | Year | |||||||||
|---|---|---|---|---|---|---|---|---|---|---|
| 1981 estimations | 1991 | 2001 | 2011 | 2021 | ||||||
| Population | % | Population | % | Population | % | Population | % | Population | % | |
| White: Total | – | 95.4% | 44,144,339 | 93.8% | 44,679,361 | 91% | 45,281,142 | 85.4% | 45,783,401 | 81% |
| White: British | – | – | – | – | 42,747,136 | 87.0% | 42,279,236 | 79.8% | 41,540,791 | 73.5% |
| White: Irish | – | – | – | – | 624,115 | 1.3% | 517,001 | 1.0% | 494,251 | 0.9% |
| White: Irish Traveller/White Gypsy | – | – | – | – | – | – | 54,895 | 0.1% | 64,218 | 0.1% |
| White: Roma | – | – | – | – | – | – | – | – | 99,138 | 0.2% |
| White: Other | – | – | – | – | 1,308,110 | 2.7% | 2,430,010 | 4.6% | 3,585,003 | 6.3% |
| Asian or Asian British: Total | – | 2.65% | 1,762,262 | 3.7% | 2,468,970 | 5% | 4,143,403 | 7.8% | 5,426,392 | 9.7% |
| Asian or Asian British: Indian | – | 1.32% | 823,821 | 1.8% | 1,028,546 | 2.1% | 1,395,702 | 2.6% | 1,843,248 | 3.3% |
| Asian or Asian British: Pakistani | – | 0.7% | 449,646 | 1.0% | 706,539 | 1.4% | 1,112,282 | 2.1% | 1,570,285 | 2.8% |
| Asian or Asian British: Bangladeshi | – | 0.18% | 157,881 | 0.3% | 275,394 | 0.6% | 436,514 | 0.8% | 629,567 | 1.1% |
| Asian or Asian British: Chinese | – | 0.22% | 141,661 | 0.3% | 220,681 | 0.5% | 379,502 | 0.7% | 431,165 | 0.8% |
| Asian or Asian British: Asian Other | – | 0.23% | 189,253 | 0.4% | 237,810 | 0.5% | 819,403 | 1.6% | 952,127 | 1.7% |
| Black or Black British: Total | – | 1.51% | 874,882 | 1.9% | 1,132,508 | 2.3% | 1,846,614 | 3.5% | 2,381,724 | 4.2% |
| Black or Black British: Caribbean | – | 0.91% | 495,682 | 1.1% | 561,246 | 1.1% | 591,016 | 1.1% | 619,419 | 1.1% |
| Black or Black British: African | – | 0.3% | 206,918 | 0.4% | 475,938 | 1.0% | 977,741 | 1.8% | 1,468,474 | 2.6% |
| Black or Black British: Other | – | 0.3% | 172,282 | 0.4% | 95,324 | 0.2% | 277,857 | 0.5% | 293,831 | 0.5% |
| British Mixed: Total | – | – | – | – | 643,373 | 1.3% | 1,192,879 | 2.3% | 1,669,378 | 2.9% |
| Mixed: White and Caribbean | – | – | – | – | 231,424 | 0.5% | 415,616 | 0.8% | 499,310 | 0.9% |
| Mixed: White and African | – | – | – | – | 76,498 | 0.2% | 161,550 | 0.3% | 241,528 | 0.4% |
| Mixed: White and Asian | – | – | – | – | 184,014 | 0.4% | 332,708 | 0.6% | 474,190 | 0.8% |
| Mixed: Other Mixed | – | – | – | – | 151,437 | 0.3% | 283,005 | 0.3% | 454,350 | 0.8% |
| Other: Total | – | 0.44% | 273,721 | 0.6% | 214,619 | 0.4% | 548,418 | 1.0% | 1,229,153 | 2.2% |
| Other: Arab | – | – | – | – | – | – | 220,985 | 0.4% | 320,203 | 0.6% |
| Other: Any other ethnic group | – | 0.44% | 273,721 | 0.6% | 214,619 | 0.4% | 327,433 | 0.6% | 908,950 | 1.6% |
| Non-White: Total | – | 4.6% | 2,910,865 | 6.2% | 4,459,470 | 9% | 7,731,314 | 14.6% | 10,706,647 | 19% |
| Total | – | 100% | 47,055,204 | 100% | 49,138,831 | 100% | 53,012,456 | 100% | 56,490,048 | 100% |
Notes for table above
Population distribution
- Population distribution of ethnic groups in 2011
- Other White (4.6%)
- Asian/Asian British: Indian (2.6%)
- Asian/Asian British: Pakistani (2.1%)
- Asian/Asian British: Bangladeshi (0.8%)
- Black/Black British: Total (3.5%)
- Other: Arab (0.4%)
- Proportion of births in regions of each broad multi-ethnic group
- White
- Asian
- Black
- Mixed
- All other ethnic groups
- Births which did not state an ethnicity
Ethnicity of school pupils
The ethnicity of school pupils in England has been changing since the figures were first published in 1997, White and especially White British students proportionally have been in decline compared to other groups who have risen.
| Ethnic group | School year | |||||||||||||||||||||
|---|---|---|---|---|---|---|---|---|---|---|---|---|---|---|---|---|---|---|---|---|---|---|
| 1997 | 2001 | 2004 | 2008 | 2010 | 2014 | 2015/16 | 2017/18 | 2019/20 | 2021/22 | 2023/24 | ||||||||||||
| Number | % | Number | % | Number | % | Number | % | Number | % | Number | % | Number | % | Number | % | Number | % | Number | % | Number | % | |
| White: Total | 5,976,100 | 89% | 5,832,501 | 86% | 5,584,800 | 82.9% | 5,389,340 | 81.3% | 5,243,870 | 79.9% | 5,222,070 | 76.9% | 5,258,582 | 75.6% | 6,027,781 | 74% | 6,048,980 | 72.8% | 6,011,045 | 71.4% | 5,877,640 | 69.1% |
| White: British | – | – | – | – | 5,408,700 | 80.3% | 5,136,610 | 77.4% | 4,963,110 | 75.6% | 4,859,730 | 71.6% | 4,822,332 | 69.3% | 5,454,108 | 66.9% | 5,432,991 | 65.4% | 5,379,748 | 63.9% | 5,212,524 | 61.3% |
| White: Irish | – | – | – | – | 26,100 | 0.3% | 23,620 | 0.4% | 22,190 | 0.3% | 21,640 | 0.3% | 21,127 | 0.3% | 23,110 | 0.3% | 22,443 | 0.3% | 21,495 | 0.3% | 20,677 | 0.2% |
| White: Roma | – | – | – | – | 6,500 | 0.1% | 3,940 | 0.1% | 4,000 | 0.1% | 4,625 | 0.1% | 22,092 | 0.3% | 26,653 | 0.3% | 28,091 | 0.3% | 27,359 | 0.3% | 28,594 | 0.3% |
| White: Irish Traveller | – | – | – | – | 3,900 | 0.1% | 8,770 | 0.1% | 10,990 | 0.2% | 19,030 | 0.3% | 4,975 | 0.1% | 6,008 | 0.1% | 6,578 | 0.1% | 6,903 | 0.1% | 6,798 | 0.1% |
| White: Other | – | – | – | – | 139,600 | 2.1% | 216,410 | 3.3% | 243,580 | 3.7% | 317,055 | 4.7% | 388,056 | 5.6% | 517,902 | 6.4% | 558,877 | 6.7% | 575,540 | 6.8% | 609,047 | 7.2% |
| Asian / Asian British: Total | – | – | 425,020 | 6.3% | 476,900 | 7.1% | 536,420 | 8.1% | 575,670 | 8.8% | 676,920 | 10.0% | 755,817 | 10.8% | 937,983 | 11.4% | 985,795 | 11.9% | 1,040,541 | 12.3% | 1,129,383 | 13.4% |
| Asian / Asian British: Indian | – | – | 162,498 | 2.4% | 154,400 | 2.3% | 161,150 | 2.4% | 163,780 | 2.5% | 180,995 | 2.7% | 196,351 | 2.8% | 247,280 | 3.0% | 268,318 | 3.2% | 289,179 | 3.4% | 337,382 | 4.0% |
| Asian / Asian British: Pakistani | – | – | 171,741 | 2.5% | 180,600 | 2.7% | 214,210 | 3.2% | 231,380 | 3.5% | 273,465 | 4.0% | 293,089 | 4.2% | 360,554 | 4.4% | 372,699 | 4.5% | 380,781 | 4.5% | 388,315 | 4.6% |
| Asian / Asian British: Bangladeshi | – | – | 66,854 | 1.0% | 72,000 | 1.1% | 87,320 | 1.3% | 95,420 | 1.5% | 110,735 | 1.6% | 117,004 | 1.7% | 143,379 | 1.8% | 148,290 | 1.8% | 151,613 | 1.8% | 151,875 | 1.8% |
| Asian / Asian British: Chinese | – | – | 23,927 | 0.4% | 23,700 | 0.4% | 24,780 | 0.4% | 24,690 | 0.4% | 26,725 | 0.4% | 28,915 | 0.4% | 36,196 | 0.4% | 37,732 | 0.5% | 48,396 | 0.6% | 63,774 | 0.8% |
| Asian / Asian British: Other Asians | – | – | – | – | 46,200 | 0.7% | 73,770 | 1.1% | 85,080 | 1.3% | 111,720 | 1.6% | 120,458 | 1.7% | 150,574 | 1.8% | 158,756 | 1.9% | 170,572 | 2.0% | 188,037 | 2.2% |
| Black / Black British: Total | – | – | 249,550 | 3.7% | 244,900 | 3.6% | 292,860 | 4.4% | 312,260 | 4.8% | 366,130 | 5.4% | 389,585 | 5.5% | 464,367 | 5.7% | 474,570 | 5.7% | 486,517 | 5.8% | 551,099 | 6.5% |
| Black: Caribbean | – | – | 99,139 | 1.5% | 96,100 | 1.4% | 92,090 | 1.4% | 91,400 | 1.4% | 89,350 | 1.3% | 85,830 | 1.2% | 91,429 | 1.1% | 86,543 | 1.0% | 82,402 | 1.0% | 78,817 | 0.9% |
| Black: African | – | – | 90,934 | 1.3% | 120,900 | 1.8% | 167,990 | 2.5% | 184,790 | 2.8% | 232,065 | 3.4% | 253,781 | 3.6% | 311,012 | 3.8% | 323,874 | 3.9% | 338,614 | 4.0% | 406,246 | 4.8% |
| Black: Other Blacks | – | – | 59,477 | 0.9% | 27,900 | 0.4% | 32,770 | 0.5% | 36,070 | 0.5% | 44,710 | 0.7% | 49,974 | 0.7% | 61,926 | 0.8% | 64,153 | 0.8% | 65,501 | 0.8% | 66,036 | 0.8% |
| Mixed / British Mixed | – | – | – | – | 181,500 | 2.7% | 229,650 | 3.5% | 256,980 | 3.9% | 325,140 | 4.8% | 363,730 | 5.3% | 473,305 | 5.8% | 515,061 | 6.1% | 558,184 | 6.6% | 594,344 | 7.0% |
| Mixed: White and Caribbean | – | – | – | – | 64,600 | 1.0% | 77,350 | 1.2% | 82,410 | 1.3% | 95,785 | 1.4% | 101,278 | 1.5% | 123,873 | 1.5% | 128,774 | 1.5% | 133,504 | 1.6% | 134,384 | 1.6% |
| Mixed: White and African | – | – | – | – | 17,000 | 0.3% | 24,110 | 0.4% | 27,860 | 0.4% | 40,245 | 0.6% | 47,472 | 0.7% | 63,518 | 0.8% | 70,403 | 0.8% | 76,262 | 0.9% | 79,940 | 0.9% |
| Mixed: White and Asian Other | – | – | – | – | 36,300 | 0.5% | 47,510 | 0.7% | 54,610 | 0.8% | 73,555 | 1.1% | 84,133 | 1.2% | 111,811 | 1.4% | 123,153 | 1.5% | 134,821 | 1.6% | 143,206 | 1.7% |
| Mixed: Other Mixed | – | – | – | – | 63,500 | 0.9% | 80,680 | 1.2% | 92,110 | 1.4% | 115,560 | 1.7% | 130,847 | 1.9% | 174,103 | 2.1% | 192,731 | 2.3% | 213,597 | 2.5% | 236,814 | 2.8% |
| Other: Total | – | – | 169,069 | 2.5% | 57,900 | 0.9% | 78,560 | 1.2% | 86,880 | 1.3% | 106,115 | 1.6% | 119,647 | 1.7% | 154,575 | 1.9% | 168,758 | 2.0% | 185,355 | 2.2% | 203,561 | 2.4% |
| Unclassified | – | – | 108,219 | 1.6% | 190,700 | 2.8% | 81,300 | 1.2% | 64,610 | 1.0% | 67,935 | 1.0% | 67,126 | 1.0% | 94,312 | 1.2% | 119,388 | 1.4% | 136,371 | 1.6% | 141,908 | 1.7% |
| Non-White: Total | 740,600 | 11% | ||||||||||||||||||||
| Total: | 6,716,700 | 100% | 6,784,458 | 100% | 6,736,700 | 100% | 6,632,900 | 100% | 6,564,940 | 100% | 6,791,030 | 100% | 6,954,487 | 100% | 8,152,323 | 100% | 8,312,552 | 100% | 8,418,013 | 100% | 8,497,935 | 100% |
- Ethnicity of school pupils in the school year of 2021/2022
- White: 71.4%
- White British: 63.9%
Languages
The most common main languages spoken in England according to the 2011 census are shown below.
| Rank | Language | Usual residents aged 3+ | Proportion |
|---|---|---|---|
| 1 | English | 46,936,780 | 92.02% |
| 2 | Polish | 529,173 | 1.04% |
| 3 | Punjabi | 271,580 | 0.53% |
| 4 | Urdu | 266,330 | 0.52% |
| 5 | Bengali (with Sylheti and Chatgaya) | 216,196 | 0.42% |
| 6 | Gujarati | 212,217 | 0.42% |
| 7 | Arabic | 152,490 | 0.30% |
| 8 | French | 145,026 | 0.28% |
| 9 | Portuguese | 131,002 | 0.26% |
| 10 | Spanish | 118,554 | 0.23% |
| 11 | Tamil | 99,773 | 0.20% |
| 12 | Turkish | 98,083 | 0.19% |
| 13 | Italian | 90,547 | 0.18% |
| 14 | Somali | 84,387 | 0.17% |
| 15 | Lithuanian | 84,327 | 0.17% |
| 16 | German | 75,190 | 0.15% |
| 17 | Persian/Farsi | 75,179 | 0.15% |
| 18 | Tagalog/Filipino | 67,593 | 0.13% |
| 19 | Romanian | 66,496 | 0.13% |
| 20 | Russian | 66,271 | 0.13% |
| – | Welsh | 8,248 | 0.02% |
| – | Cornish | 554 | 0.00% |
| – | Other | 1,209,614 | 2.37% |
| Total population | 51,005,610 | 100.00% |
Religion
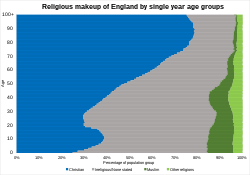
- Christianity (46.3%)
- Not religious (36.7%)
- Islam (6.70%)
- Not stated (6.00%)
- Other religions (2.50%)
- Hinduism (1.80%)
Respondents to the 2001, 2011 and 2021 censuses gave their religions as follows:
| Religion | 2001 | 2011 | 2021 | |||
|---|---|---|---|---|---|---|
| Number | % | Number | % | Number | % | |
| Christian | 35,251,244 | 71.74% | 31,479,876 | 59.38% | 26,167,899 | 46.3% |
| Muslim | 1,524,887 | 3.10% | 2,660,116 | 5.02% | 3,801,186 | 6.7% |
| Hindu | 546,982 | 1.11% | 806,199 | 1.52% | 1,032,533 | 1.8% |
| Sikh | 327,343 | 0.67% | 420,196 | 0.79% | 520,092 | 0.9% |
| Jewish | 257,671 | 0.52% | 261,282 | 0.49% | 269,283 | 0.5% |
| Buddhist | 139,046 | 0.28% | 238,626 | 0.45% | 262,433 | 0.5% |
| Other religion | 143,811 | 0.29% | 227,825 | 0.43% | 332,410 | 0.6% |
| No religion | 7,171,332 | 14.59% | 13,114,232 | 24.74% | 20,715,664 | 36.7% |
| Religion not stated | 3,776,515 | 7.69% | 3,804,104 | 7.18% | 3,400,548 | 6.0% |
| Total population | 49,138,831 | 100.00% | 53,012,456 | 100.00% | 56,490,048 | 100.0% |
See also
- Demographics of the United Kingdom
- Demographics of Scotland
- Demographics of Wales
- Demographics of Northern Ireland
- Demographics of London
- Demographics of Birmingham
- Demographics of Greater Manchester
- United Kingdom Census 2011
- National Statistics Socio-economic Classification
- Census 2001 Ethnic Codes
- List of English districts by population
- List of urban areas in England by population
- List of towns and cities in England by historical population
- List of major settlements by population in English counties