Demographics of Tunisia
In-game article clicks load inline without leaving the challenge.

All figures are from National Institute of Statistics and the United Nations Demographic Yearbooks, unless otherwise indicated.
Tunisia's population was estimated to be around 12.04 million in 2022. In the generally youthful African continent, Tunisia's population is among the most mature. This is because the government has supported a successful family planning program that has reduced the population growth rate to just over 1% per annum, contributing to Tunisia's economic and social stability.
The population of Tunisia is made up of Arabs (98%), Berbers (1%), and others (1%). Around 98 percent of the population are Muslim. There is a Jewish population on the southern island of Djerba and in Tunis. There also exists a small autochthonous group of Christian adherents.
Population History
| Year | Pop. | ±% p.a. |
|---|---|---|
| 0 | 800,000 | — |
| 500 | 850,000 | +0.01% |
| 1000 | 1,000,000 | +0.03% |
| 1500 | 800,000 | −0.04% |
| 1700 | 800,000 | +0.00% |
| 1900 | 1,880,000 | +0.43% |
| 1960 | 4,220,701 | +1.36% |
| 1970 | 5,127,000 | +1.96% |
| 1980 | 6,384,000 | +2.22% |
| 1990 | 8,154,400 | +2.48% |
| 2000 | 9,563,500 | +1.61% |
| 2010 | 10,547,000 | +0.98% |
| 2020 | 11,818,619 | +1.14% |
Source: National Institute of Statistics and United Nations Statistics Division
Vital statistics
| Average population (July 1) | Live births | Deaths | Natural change | Crude birth rate (per 1,000) | Crude death rate (per 1,000) | Natural change (per 1,000) | Crude migration rate (per 1,000) | Population growth (annual %) | Fertility rates | |
|---|---|---|---|---|---|---|---|---|---|---|
| 1948 | 3,425,100 | 111,084 | 49,917 | 61,167 | 32.4 | 14.6 | 17.8 | |||
| 1949 | 3,489,400 | 92,439 | 35,409 | 57,030 | 26.5 | 10.1 | 16.4 | 2.0 | 1.877 | |
| 1950 | 3,530,000 | 106,235 | 33,648 | 72,587 | 30.1 | 9.5 | 20.6 | -9.1 | 1.164 | |
| 1951 | 3,596,000 | 119,981 | 33,935 | 86,046 | 33.4 | 9.4 | 24.0 | -5.6 | 1.870 | |
| 1952 | 3,662,000 | 105,469 | 30,676 | 74,793 | 28.8 | 8.4 | 20.4 | -2.4 | 1.835 | |
| 1953 | 3,727,000 | 116,638 | 31,116 | 85,522 | 31.3 | 8.3 | 23.0 | -5.6 | 1.775 | 6.90 |
| 1954 | 3,793,000 | 119,774 | 31,249 | 88,525 | 31.6 | 8.2 | 23.4 | -6.0 | 1.771 | |
| 1955 | 3,860,000 | 134,489 | 28,942 | 105,547 | 34.8 | 7.5 | 27.3 | -9.9 | 1.766 | |
| 1956 | 3,929,000 | 140,505 | 33,367 | 107,138 | 35.8 | 8.5 | 27.3 | -9.7 | 1.788 | |
| 1957 | 3,999,000 | 157,741 | 36,964 | 120,777 | 39.4 | 9.2 | 30.2 | -12.7 | 1.782 | |
| 1958 | 4,072,000 | 181,144 | 37,018 | 144,126 | 44.5 | 9.1 | 35.4 | -17.5 | 1.825 | 7.00 |
| 1959 | 4,145,000 | 184,209 | 41,737 | 142,472 | 44.4 | 10.1 | 34.3 | -16.7 | 1.793 | |
| 1960 | 4,220,701 | 182,221 | 42,064 | 140,157 | 43.2 | 10.0 | 33.2 | -15.3 | 1.826 | |
| 1961 | 4,297,000 | 184,396 | 45,437 | 138,959 | 42.9 | 10.6 | 32.3 | -14.5 | 1.808 | |
| 1962 | 4,376,000 | 181,861 | 49,200 | 132,661 | 41.6 | 11.2 | 30.4 | -12.3 | 1.838 | |
| 1963 | 4,457,000 | 187,395 | 45,415 | 141,980 | 42.0 | 10.2 | 31.8 | -13.6 | 1.851 | 7.21 |
| 1964 | 4,541,000 | 206,046 | 43,656 | 162,390 | 45.4 | 9.6 | 35.8 | -17.3 | 1.885 | |
| 1965 | 4,630,000 | 193,220 | 51,700 | 141,520 | 41.7 | 11.2 | 30.2 | -11.0 | 1.960 | |
| 1966 | 4,716,000 | 206,717 | 48,307 | 158,410 | 43.8 | 10.2 | 33.6 | -15.4 | 1.857 | 7.22 |
| 1967 | 4,819,000 | 187,320 | 49,387 | 137,933 | 38.9 | 10.2 | 28.7 | -7.3 | 2.184 | |
| 1968 | 4,920,000 | 188,190 | 46,712 | 141,478 | 38.3 | 9.5 | 28.8 | -8.3 | 2.096 | 6.86 |
| 1969 | 5,027,500 | 194,940 | 52,872 | 142,068 | 38.8 | 10.5 | 28.3 | -6.9 | 2.185 | |
| 1970 | 5,126,500 | 186,360 | 45,560 | 140,800 | 36.4 | 8.9 | 27.5 | -8.2 | 1.969 | 6.09 |
| 1971 | 5,228,400 | 183,311 | 48,625 | 134,686 | 35.1 | 9.3 | 25.8 | -7.3 | 1.988 | 6.00 |
| 1972 | 5,331,800 | 199,121 | 39,488 | 159,633 | 37.3 | 7.4 | 29.9 | -10.5 | 1.978 | |
| 1973 | 5,333,400 | 194,810 | 60,800 | 134,010 | 36.5 | 11.4 | 25.1 | -24.8 | 0.030 | 6.18 |
| 1974 | 5,463,700 | 194,600 | 54,700 | 139,900 | 35.6 | 10.0 | 25.6 | -1.8 | 2.443 | |
| 1975 | 5,611,400 | 205,390 | 41,172 | 164,218 | 36.6 | 7.3 | 29.3 | -3.0 | 2.703 | |
| 1976 | 5,774,900 | 208,040 | 37,028 | 171,012 | 36.0 | 6.4 | 29.6 | -1.3 | 2.914 | |
| 1977 | 5,928,300 | 220,546 | 36,272 | 184,274 | 37.2 | 6.1 | 31.1 | -5.2 | 2.656 | |
| 1978 | 6,067,100 | 207,342 | 34,885 | 172,457 | 34.2 | 5.7 | 28.5 | -5.6 | 2.341 | 5.14 |
| 1979 | 6,219,800 | 218,161 | 37,201 | 180,960 | 35.1 | 6.0 | 29.1 | -4.5 | 2.517 | 4.92 |
| 1980 | 6,392,300 | 225,165 | 36,445 | 188,720 | 35.2 | 5.7 | 29.5 | -2.5 | 2.773 | 4.51 |
| 1981 | 6,565,500 | 226,425 | 36,989 | 189,436 | 34.5 | 5.6 | 28.9 | -2.5 | 2.710 | |
| 1982 | 6,703,600 | 219,393 | 36,069 | 183,324 | 32.7 | 5.4 | 27.3 | -6.7 | 2.103 | |
| 1983 | 6,839,500 | 216,365 | 35,054 | 181,311 | 31.6 | 5.1 | 26.5 | -6.6 | 2.027 | 4.88 |
| 1984 | 7,033,900 | 227,052 | 33,740 | 193,312 | 32.3 | 4.8 | 27.5 | 0.1 | 2.842 | 4.66 |
| 1985 | 7,261,100 | 227,188 | 35,963 | 191,225 | 31.3 | 5.0 | 26.3 | 5.0 | 3.230 | 4.42 |
| 1986 | 7,464,900 | 234,736 | 35,467 | 199,269 | 31.4 | 4.8 | 26.6 | 0.7 | 2.807 | 4.39 |
| 1987 | 7,639,000 | 224,169 | 35,632 | 188,537 | 29.3 | 4.7 | 24.6 | -1.8 | 2.332 | 4.07 |
| 1988 | 7,769,900 | 215,069 | 34,984 | 180,085 | 27.7 | 4.5 | 23.2 | -6.4 | 1.714 | 3.78 |
| 1989 | 7,909,600 | 199,459 | 34,921 | 164,538 | 25.2 | 4.4 | 20.8 | -3.1 | 1.798 | 3.36 |
| 1990 | 8,154,400 | 205,315 | 45,700 | 159,615 | 25.2 | 5.6 | 19.6 | -10.4 | 3.095 | 3.35 |
| 1991 | 8,318,200 | 207,455 | 46,500 | 160,955 | 24.9 | 5.6 | 19.3 | 0.4 | 2.009 | 3.28 |
| 1992 | 8,489,900 | 211,649 | 46,300 | 165,349 | 24.9 | 5.5 | 19.5 | 0.7 | 2.064 | 3.25 |
| 1993 | 8,657,400 | 207,786 | 49,400 | 158,386 | 24.0 | 5.7 | 18.3 | 1.0 | 1.973 | 3.12 |
| 1994 | 8,815,300 | 200,223 | 50,300 | 149,923 | 22.7 | 5.7 | 17.0 | 0.9 | 1.824 | 2.90 |
| 1995 | 8,957,500 | 186,416 | 52,000 | 134,416 | 20.8 | 5.8 | 15.0 | 0.9 | 1.613 | 2.67 |
| 1996 | 9,089,300 | 178,801 | 49,800 | 129,001 | 19.7 | 5.5 | 14.2 | 0.3 | 1.471 | 2.51 |
| 1997 | 9,214,900 | 173,757 | 51,700 | 122,057 | 18.9 | 5.6 | 13.2 | 0.4 | 1.382 | 2.38 |
| 1998 | 9,333,300 | 166,718 | 52,300 | 114,418 | 17.9 | 5.6 | 12.3 | 0.4 | 1.285 | 2.23 |
| 1999 | 9,455,900 | 160,169 | 54,400 | 105,769 | 16.9 | 5.8 | 11.2 | 1.8 | 1.314 | 2.09 |
| 2000 | 9,552,500 | 163,089 | 53,700 | 109,389 | 17.1 | 5.6 | 11.5 | -1.3 | 1.022 | 2.08 |
| 2001 | 9,650,600 | 163,919 | 53,210 | 110,709 | 17.0 | 5.5 | 11.5 | -1.2 | 1.027 | 2.05 |
| 2002 | 9,748,900 | 163,011 | 57,048 | 105,963 | 16.7 | 5.9 | 10.9 | -0.7 | 1.019 | 2.00 |
| 2003 | 9,839,841 | 168,022 | 59,779 | 108,243 | 17.1 | 6.1 | 11.0 | -1.8 | 0.933 | 2.06 |
| 2004 | 9,932,431 | 166,551 | 59,234 | 107,317 | 16.8 | 6.0 | 10.8 | -1.5 | 0.941 | 2.02 |
| 2005 | 10,038,508 | 170,999 | 58,673 | 112,326 | 17.0 | 5.8 | 11.2 | -1.6 | 0.973 | 2.04 |
| 2006 | 10,141,800 | 173,390 | 56,998 | 116,392 | 17.1 | 5.6 | 11.5 | -1.7 | 0.985 | 2.03 |
| 2007 | 10,225,200 | 177,503 | 56,743 | 120,760 | 17.4 | 5.5 | 11.8 | -2.3 | 0.961 | 2.04 |
| 2008 | 10,328,700 | 182,990 | 59,975 | 123,015 | 17.7 | 5.8 | 11.9 | -1.9 | 1.012 | 2.06 |
| 2009 | 10,458,095 | 198,010 | 59,499 | 138,511 | 18.9 | 5.7 | 13.2 | -1.9 | 1.253 | 2.05 |
| 2010 | 10,477,321 | 204,288 | 53,780 | 150,508 | 19.5 | 5.1 | 14.4 | -2.7 | 1.029 | 2.13 |
| 2011 | 10,610,629 | 206,403 | 59,930 | 146,473 | 19.5 | 5.6 | 13.8 | -2.7 | 1.029 | 2.29 |
| 2012 | 10,748,166 | 217,738 | 63,260 | 154,478 | 20.3 | 5.9 | 14.4 | -4.1 | 1.029 | 2.39 |
| 2013 | 10,880,853 | 222,962 | 61,730 | 161,232 | 20.5 | 5.7 | 14.8 | -4.6 | 1.029 | 2.43 |
| 2014 | 11,017,049 | 225,887 | 62,790 | 163,097 | 20.5 | 5.7 | 14.8 | -4.2 | 1.076 | 2.46 |
| 2015 | 11,158,628 | 222,534 | 69,644 | 152,890 | 19.9 | 6.2 | 13.7 | -0.2 | 1.364 | 2.42 |
| 2016 | 11,292,778 | 219,441 | 66,298 | 153,143 | 19.4 | 5.9 | 13.6 | -1.0 | 1.270 | 2.40 |
| 2017 | 11,418,218 | 209,474 | 74,002 | 135,472 | 18.3 | 6.5 | 11.9 | -0.3 | 1.155 | 2.29 |
| 2018 | 11,532,078 | 202,693 | 72,716 | 129,977 | 17.6 | 6.3 | 11.3 | -2.8 | 0.849 | 2.23 |
| 2019 | 11,638,066 | 195,823 | 76,091 | 119,732 | 16.8 | 6.5 | 10.3 | -1.2 | 0.919 | 2.17 |
| 2020 | 11,726,178 | 174,116 | 79,891 | 94,225 | 14.8 | 6.8 | 8.0 | -0.5 | 0.757 | 1.96 |
| 2021 | 11,783,723 | 160,268 | 107,006 | 53,262 | 13.6 | 9.1 | 4.5 | 0.4 | 0.491 | 1.82 |
| 2022 | 11,826,910 | 147,978 | 81,334 | 66,644 | 12.5 | 6.9 | 5.6 | -2.2 | 0.366 | 1.70 |
| 2023 | 11,868,822 | 135,148 | 77,967 | 57,181 | 11.4 | 6.6 | 4.8 | -1.3 | 0.354 | 1.58 |
| 2024 | 11,916,318(e) | 124,850 | 70,707 | 54,143 | 10.0 | 5.6 | 4.4 | 1.45 | ||
| 2025 | 11,962,696(e) |
Current vital statistics
| Period | Live births | Deaths | Natural increase |
|---|---|---|---|
| January—June 2024 | 61,490 | 36,247 | +25,243 |
| January—June 2025 | 51,053 | 33,575 | +17,478 |
| Difference | -10,437 (-16.97%) | -2,672 (-7.37%) | -7,765 |
| Source: |
Regional data

| Rank | Governorate | Population (1994) | Population (2004) | Population (2014) | Population (2024) | Variation 1994–2024 (%) |
|---|---|---|---|---|---|---|
| 1 | Tunis | 887,803 | 983,861 | 1,056,247 | 1,075,306 | +21.1% |
| 2 | Sfax | 733,687 | 855,256 | 955,421 | 1,047,468 | +42.8% |
| 3 | Nabeul | 578,618 | 693,890 | 787,918 | 863,172 | +49.2% |
| 4 | Sousse | 433,709 | 544,413 | 674,818 | 762,281 | +75.8% |
| 5 | Ben Arous | 371,745 | 505,773 | 631,842 | 722,828 | +94.4% |
| 6 | Ariana | 290,634 | 422,246 | 576,088 | 668,552 | +129.9% |
| 7 | Bizerte | 483,086 | 524,128 | 568,219 | 607,388 | +25.7% |
| 8 | Kairouan | 532,709 | 546,209 | 570,436 | 600,803 | +12.8% |
| 9 | Monastir | 363,901 | 455,590 | 548,828 | 599,769 | +64.8% |
| 10 | Médenine | 386,185 | 432,503 | 479,520 | 537,255 | +39.1% |
| 11 | Kasserine | 386,908 | 412,278 | 439,243 | 492,741 | +27.3% |
| 12 | Sidi Bouzid | 377,143 | 395,506 | 429,912 | 489,991 | +29.9% |
| 13 | Mahdia | 335,744 | 377,853 | 410,812 | 449,985 | +34.0% |
| 14 | Manouba | 278,660 | 335,912 | 379,518 | 418,354 | +50.1% |
| 15 | Gabès | 311,713 | 342,630 | 374,300 | 410,847 | +31.8% |
| 16 | Jendouba | 404,783 | 416,608 | 401,477 | 404,352 | -0.1% |
| 17 | Gafsa | 307,513 | 323,709 | 337,331 | 388,776 | +26.4% |
| 18 | Béja | 303,853 | 304,501 | 303,032 | 311,417 | +2.5% |
| 19 | Kef | 272,352 | 258,790 | 243,156 | 237,686 | -12.7% |
| 20 | Siliana | 244,910 | 233,985 | 223,087 | 216,242 | -11.7% |
| 21 | Zaghouan | 143,036 | 160,963 | 176,945 | 201,065 | +40.6% |
| 22 | Kébili | 131,914 | 143,218 | 156,961 | 183,201 | +38.9% |
| 23 | Tataouine | 135,703 | 143,524 | 149,453 | 162,654 | +19.9% |
| 24 | Tozeur | 89,055 | 97,526 | 107,912 | 120,036 | +34.8% |
| Source : Institut national de la statistique |
Structure of the population
| Age Group | Male | Female | Total | Percent |
|---|---|---|---|---|
| Total | 5 472 333 | 5 510 420 | 10 982 753 | 100 |
| 0–4 | 505 509 | 466 662 | 972 171 | 8.85 |
| 5–9 | 440 644 | 408 362 | 849 006 | 7.73 |
| 10–14 | 407 938 | 381 684 | 789 622 | 7.19 |
| 15–19 | 421 716 | 405 792 | 827 508 | 7.53 |
| 20–24 | 459 814 | 465 595 | 925 409 | 8.43 |
| 25–29 | 449 932 | 484 685 | 934 617 | 8.51 |
| 30–34 | 477 322 | 506 459 | 983 781 | 8.96 |
| 35–39 | 397 594 | 419 392 | 816 986 | 7.44 |
| 40–44 | 357 353 | 370 495 | 727 848 | 6.63 |
| 45–49 | 331 283 | 351 673 | 682 956 | 6.22 |
| 50–54 | 324 423 | 326 185 | 650 608 | 5.92 |
| 55–59 | 268 380 | 266 788 | 535 168 | 4.87 |
| 60–64 | 212 900 | 212 524 | 425 424 | 3.87 |
| 65–69 | 127 168 | 135 135 | 262 303 | 2.39 |
| 70–74 | 107 097 | 113 584 | 220 681 | 2.01 |
| 75–79 | 81 732 | 85 164 | 166 896 | 1.52 |
| 80+ | 101 528 | 110 241 | 211 769 | 1.93 |
| Age group | Male | Female | Total | Percent |
| 0–14 | 1 354 091 | 1 256 708 | 2 610 799 | 23.77 |
| 15–64 | 3 700 717 | 3 809 588 | 7 510 305 | 68.38 |
| 65+ | 417 525 | 444 124 | 861 649 | 7.85 |
| Age group | Male | Female | Total | % |
|---|---|---|---|---|
| Total | 5 845 771 | 5 937 951 | 11 783 722 | 100 |
| 0–4 | 926 069 | 7.86 | ||
| 5–9 | 1 070 239 | 9.08 | ||
| 10–14 | 944 533 | 8.02 | ||
| 15–19 | 805 973 | 6.84 | ||
| 20–24 | 769 307 | 6.53 | ||
| 25–29 | 845 867 | 7.18 | ||
| 30–34 | 862 847 | 7.32 | ||
| 35–39 | 900 584 | 7.64 | ||
| 40–44 | 858 461 | 7.29 | ||
| 45–49 | 780 961 | 6.63 | ||
| 50–54 | 680 158 | 5.77 | ||
| 55–59 | 665 392 | 5.65 | ||
| 60–64 | 544 471 | 4.62 | ||
| 65-69 | 461 708 | 3.92 | ||
| 70-74 | 286 317 | 2.43 | ||
| 75-79 | 181 675 | 1.54 | ||
| 80+ | 199 161 | 1.69 | ||
| Age group | Male | Female | Total | Percent |
| 0–14 | 2 940 841 | 24.96 | ||
| 15–64 | 7 714 020 | 65.46 | ||
| 65+ | 1 128 861 | 9.58 |
Life expectancy


total population: 76.82 years. Country comparison to the world: 99th
male: 75.14 years
female: 78.6 years (2022 est.)
| Period | Life expectancy in Years | Period | Life expectancy in Years |
|---|---|---|---|
| 1950–1955 | 38.8 | 1985–1990 | 67.1 |
| 1955–1960 | 40.7 | 1990–1995 | 70.3 |
| 1960–1965 | 43.7 | 1995–2000 | 72.4 |
| 1965–1970 | 48.3 | 2000–2005 | 73.7 |
| 1970–1975 | 54.1 | 2005–2010 | 74.6 |
| 1975–1980 | 59.4 | 2010–2015 | 75.0 |
| 1980–1985 | 64.3 |
Source: UN World Population Prospects
Ethnic groups
The majority of the population of Tunisia is made up of Arabs (98% of the population). The first people known to history in what is now Tunisia were the Berbers, who currently make up 1% of the population, and were ultimately conquered by the Arabs in the 7th century. There was a continuing inflow of nomadic Arab tribes to the Maghreb from the Arabian Peninsula since the 7th century with a major wave in the 11th century.
Whilst the Ottoman influence has been particularly significant in forming the Turco-Tunisian community, other peoples have also migrated to Tunisia during different periods of time, including Sub-Saharan Africans, Greeks, Romans, Phoenicians (Punics), Jews, and French settlers. The Tunisian, by 1870 the distinction between the Arabic-speaking mass and the Turkish elite had blurred. There is also a small Berber (1% at most) population located in the Dahar mountains and on the island of Djerba in the south-east and in the Khroumire mountainous region in the north-west.
From the late 19th century to after World War II, Tunisia was home to large populations of French and Italians (255,000 Europeans in 1956), although nearly all of them, along with the Jewish population, left after Tunisia became independent. The history of the Jews in Tunisia goes back some 2,000 years. In 1948 the Jewish population was an estimated 105,000, but by 2013 only about 900 remained.
After the Reconquista and expulsion of non-Christians and Moriscos from Spain, many Spanish Muslims and Jews also arrived. According to Matthew Carr, "As many as eighty thousand Moriscos settled in Tunisia, most of them in and around the capital, Tunis, which still contains a quarter known as Zuqaq al-Andalus, or Andalusia Alley."
Genetics
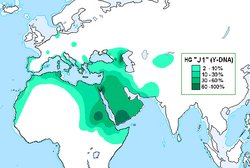
Tunisians mainly carry haplogroup J1 (34.2%) and haplogroup E (55%).
"In fact, the Tunisian genetic distances to European samples are smaller than those to North African groups. (...) This could be explained by the history of the Tunisian population, reflecting the influence of the ancient Punic settlers of Carthage followed, among others, by Roman, Byzantine, Arab and French occupations, according to historical records. Notwithstanding, other explanations cannot be discarded, such as the relative heterogeneity within current Tunisian populations, and/or the limited sub-Saharan genetic influence in this region as compared with other North African areas, without excluding the possibility of the genetic drift, whose effect might be particularly amplified on the X chromosome.",
However, other research has suggested instead that Tunisians exhibit a mostly indigenous North African ancestral component similar to other Northwest African populations; characterized by a high amount of native Northwest African genes, but with higher Middle Eastern input than in Algeria or Morocco.
Y-Chromosome


Listed here are the human Y-chromosome DNA haplogroups in Tunisia.
| Haplogroup | Marker | Tunisia |
|---|---|---|
| n | 601 | |
| B | 0.17% | |
| E1a | M33 | 0.5% |
| E1b1a | M2 | 0.67% |
| E1b1b1 | M35 | 1.66% |
| E1b1b1a3 | V22 | 3% |
| E1b1b1a4 | V65 | 3.16% |
| E1b1b1b | M81 | 62.73% |
| E1b1b1c | M34 | 1.16% |
| F | M89 | 2.66% |
| G | M201 | 0.17% |
| I | 0.17% | |
| J1 | 16.64% | |
| J2 | 2.83% | |
| K | 0.33% | |
| P,R | 0.33% | |
| R1a1 | 0.5% | |
| R1b1a | V88 | 1.83% |
| R1b1b | M269 | 0.33% |
| T | M70 | 1.16% |
Emigration
According to statistics from the Tunisian Office for Foreign Nationals. (OTE), the Tunisian diaspora consists of approximately 2.54 million people, with 49% of them residing in France. France has historically hosted a large portion of the Tunisian emigrants, due to historical ties and labor agreements between the two countries.
Detailed article : Tunisian diaspora

| Country | Total | Percentage |
|---|---|---|
| Europe | 1,942,000 | 76.4 % |
| France | 1,338,000 | 52.7 % |
| Italy | 123,828 | 14.6 % |
| Germany | 188,000 | 7.4 % |
| North Africa and Middle East | 365,000 | 14.4 % |
| Qatar | 132,000 | 5.2 % |
| Americas | 142,000 | 5.6 % |
| Canada | 35,000 | 1.4 % |
| Subsaharan Africa | 75,000 | 3.0 % |
| Australia and Asia | 13,973 | 0.6 % |
| Total | 2,540,000 | 100 % |
Migration
| Country of origin | 2020 |
|---|---|
| Algeria | 11,060 |
| Libya | 9,688 |
| France | 9,151 |
| Morocco | 6,146 |
| Italy | 2,345 |
| Germany | 1,537 |
| Syria | 1,382 |
| Egypt | 1,206 |
| Mali | 1,058 |
| Total | 60,415 |
Languages
- Modern Standard Arabic (official, one of the languages of commerce and education)
- Tunisian Arabic (local dialect of Arabic, everyday use)
- French (commerce and education)
- Berber (minority language spoken by <1% of the population)
Religion
Muslim (official; Sunni) 99%, other (includes Christian, Jewish, Shia Muslim, and Baha'i) <1%