Huntingdon County, Pennsylvania
In-game article clicks load inline without leaving the challenge.
Huntingdon County is a county in the Commonwealth of Pennsylvania. As of the 2020 census, the population was 44,092. Its county seat is Huntingdon. The county was created on September 20, 1787, mainly from the northern part of Bedford County, plus an addition of territory on the east (Big Valley, Tuscarora Valley) from Cumberland County. The county is part of the Southwest region of the commonwealth.
Huntingdon County comprises the Huntingdon, PA Micropolitan Statistical Area.
Geography
According to the U.S. Census Bureau, the county has a total area of 889 square miles (2,300 km2), of which 875 square miles (2,270 km2) is land and 15 square miles (39 km2) (1.6%) is water. It has a humid continental climate (Dfa/Dfb) and average monthly temperatures in Huntingdon borough range from 27.8 °F in January to 72.3 °F in July. Huntingdon County is one of the 423 counties served by the Appalachian Regional Commission, and it is identified as part of "Greater Appalachia" by Colin Woodard in his book American Nations: A History of the Eleven Rival Regional Cultures of North America.

Features
Adjacent counties
- Centre County (north)
- Mifflin County (east)
- Juniata County (east)
- Franklin County (southeast)
- Fulton County (south)
- Bedford County (southwest)
- Blair County (west)
Demographics
| Census | Pop. | Note | %± |
|---|---|---|---|
| 1790 | 7,558 | — | |
| 1800 | 13,008 | 72.1% | |
| 1810 | 14,778 | 13.6% | |
| 1820 | 20,142 | 36.3% | |
| 1830 | 27,145 | 34.8% | |
| 1840 | 35,484 | 30.7% | |
| 1850 | 24,786 | −30.1% | |
| 1860 | 28,100 | 13.4% | |
| 1870 | 31,251 | 11.2% | |
| 1880 | 33,954 | 8.6% | |
| 1890 | 35,751 | 5.3% | |
| 1900 | 34,650 | −3.1% | |
| 1910 | 38,304 | 10.5% | |
| 1920 | 39,848 | 4.0% | |
| 1930 | 39,021 | −2.1% | |
| 1940 | 41,836 | 7.2% | |
| 1950 | 40,872 | −2.3% | |
| 1960 | 39,457 | −3.5% | |
| 1970 | 39,108 | −0.9% | |
| 1980 | 42,253 | 8.0% | |
| 1990 | 44,164 | 4.5% | |
| 2000 | 45,586 | 3.2% | |
| 2010 | 45,913 | 0.7% | |
| 2020 | 44,092 | −4.0% | |
| 2025 (est.) | 43,001 | −2.5% | |
| U.S. Decennial Census 1790-1960 1900-1990 1990-2000 2010-2017 |

2020 census
As of the 2020 census, the county had a population of 44,092 and a median age of 44.2 years. 18.2% of residents were under the age of 18 and 21.7% of residents were 65 years of age or older. For every 100 females there were 114.0 males, and for every 100 females age 18 and over there were 116.1 males age 18 and over.
According to the 2020 redistricting data (PL 94-171), the racial composition was 39,420 (89.4%) non-Hispanic White, 2,267 (5.14%) non-Hispanic Black or African American, 49 (0.11%) non-Hispanic Native American, 210 (0.47%) non-Hispanic Asian, 9 (0.02%) non-Hispanic Pacific Islander, 1,285 (3.0%) non-Hispanic Other/Mixed, and 852 (2.0%) Hispanic or Latino residents of any race.
25.7% of residents lived in urban areas while 74.3% lived in rural areas.
There were 16,804 households in the county, of which 25.3% had children under the age of 18 living in them. Of all households, 51.1% were married-couple households, 18.4% were households with a male householder and no spouse or partner present, and 23.6% were households with a female householder and no spouse or partner present. About 29.7% of all households were made up of individuals and 15.1% had someone living alone who was 65 years of age or older.
There were 20,807 housing units, of which 19.2% were vacant. Among occupied housing units, 76.0% were owner-occupied and 24.0% were renter-occupied. The homeowner vacancy rate was 1.4% and the rental vacancy rate was 7.1%.
| Race / Ethnicity (NH = Non-Hispanic) | Pop 2000 | Pop 2010 | Pop 2020 | % 2000 | % 2010 | % 2020 |
|---|---|---|---|---|---|---|
| White alone (NH) | 42,305 | 42,197 | 39,420 | 92.80% | 91.90% | 89.40% |
| Black or African American alone (NH) | 2,334 | 2,369 | 2,267 | 5.11% | 5.15% | 5.14% |
| Native American or Alaska Native alone (NH) | 44 | 36 | 49 | 0.09% | 0.07% | 0.11% |
| Asian alone (NH) | 94 | 181 | 210 | 0.20% | 0.39% | 0.47% |
| Pacific Islander alone (NH) | 0 | 0 | 9 | 0.00% | 0.00% | 0.02% |
| Other race alone (NH) | 33 | 22 | 100 | 0.07% | 0.04% | 0.22% |
| Mixed race or Multiracial (NH) | 252 | 381 | 1,185 | 0.55% | 0.82% | 2.68% |
| Hispanic or Latino (any race) | 524 | 727 | 852 | 1.14% | 1.58% | 1.93% |
| Total | 45,586 | 45,913 | 44,092 | 100.00% | 100.00% | 100.00% |
2010 census
As of the 2010 census, there were 45,913 people and 17,280 households within the county. The population density was 52 people per square mile (20 people/km2). There were 22,365 housing units at an average density of 24 units per square mile (9.3/km2). The racial makeup of the county was 92.50% White, 5.21% Black or African American, 0.09% Native American, 0.40% Asian, 0.01% Pacific Islander, 0.87% from other races, and 0.92% from two or more races. 1.58% of the population were Hispanic or Latino of any race. 33.9% were of German, 17.1% American, 11.1% Irish, 7.5% English and 5.7% Italian ancestry.
There were 16,759 households, out of which 30.10% had children under the age of 18 living with them, 58.10% were married couples living together, 8.30% had a female householder with no husband present, and 29.60% were non-families. 25.80% of all households were made up of individuals, and 12.30% had someone living alone who was 65 years of age or older. The average household size was 2.44 and the average family size was 2.92.
In the county, the population was spread out, with 21.70% under the age of 18, 10.10% from 18 to 24, 29.40% from 25 to 44, 24.00% from 45 to 64, and 14.80% who were 65 years of age or older. The median age was 38 years. For every 100 females there were 109.60 males. For every 100 females age 18 and over, there were 110.20 males.
Almost everyone that lives in Huntingdon County speaks English as their first language. The dominant form of speech in Huntingdon County is the Central Pennsylvania accent of English. In some areas of the county, such as Kishacoquillas Valley, where many Amish and Mennonite people live, a dialect of German known as Pennsylvania Dutch (from Deutsch, the word for German) is commonly spoken.
Micropolitan Statistical Area
The United States Office of Management and Budget has designated Huntingdon County as the Huntingdon, PA Micropolitan Statistical Area (μSA). As of the 2010 census the micropolitan area ranked 11th most populous in the State of Pennsylvania and the 249th most populous in the United States with a population of 45,913.
Law and government
| Year | Republican | Democratic | Third party(ies) | |||
|---|---|---|---|---|---|---|
| No. | % | No. | % | No. | % | |
| 1888 | 4,217 | 58.56% | 2,789 | 38.73% | 195 | 2.71% |
| 1892 | 3,994 | 57.66% | 2,675 | 38.62% | 258 | 3.72% |
| 1896 | 4,969 | 66.06% | 2,305 | 30.64% | 248 | 3.30% |
| 1900 | 4,645 | 67.91% | 1,989 | 29.08% | 206 | 3.01% |
| 1904 | 4,587 | 73.11% | 1,324 | 21.10% | 363 | 5.79% |
| 1908 | 4,503 | 66.34% | 1,917 | 28.24% | 368 | 5.42% |
| 1912 | 903 | 14.33% | 1,538 | 24.41% | 3,859 | 61.25% |
| 1916 | 3,806 | 60.23% | 2,181 | 34.51% | 332 | 5.25% |
| 1920 | 5,232 | 67.74% | 1,784 | 23.10% | 708 | 9.17% |
| 1924 | 6,567 | 73.99% | 1,488 | 16.77% | 820 | 9.24% |
| 1928 | 9,920 | 86.25% | 1,470 | 12.78% | 112 | 0.97% |
| 1932 | 7,371 | 66.39% | 3,426 | 30.86% | 306 | 2.76% |
| 1936 | 9,815 | 56.43% | 7,429 | 42.72% | 148 | 0.85% |
| 1940 | 9,141 | 61.64% | 5,631 | 37.97% | 58 | 0.39% |
| 1944 | 8,106 | 65.80% | 4,131 | 33.53% | 83 | 0.67% |
| 1948 | 6,943 | 67.76% | 3,304 | 32.24% | 0 | 0.00% |
| 1952 | 9,580 | 68.61% | 4,318 | 30.93% | 64 | 0.46% |
| 1956 | 9,698 | 67.66% | 4,618 | 32.22% | 17 | 0.12% |
| 1960 | 11,116 | 70.07% | 4,710 | 29.69% | 38 | 0.24% |
| 1964 | 6,571 | 46.81% | 7,435 | 52.96% | 33 | 0.24% |
| 1968 | 8,276 | 61.82% | 4,128 | 30.83% | 984 | 7.35% |
| 1972 | 9,606 | 72.68% | 3,394 | 25.68% | 216 | 1.63% |
| 1976 | 7,843 | 58.26% | 5,410 | 40.19% | 209 | 1.55% |
| 1980 | 8,140 | 58.44% | 5,094 | 36.57% | 694 | 4.98% |
| 1984 | 10,220 | 69.57% | 4,430 | 30.15% | 41 | 0.28% |
| 1988 | 8,800 | 64.56% | 4,752 | 34.86% | 79 | 0.58% |
| 1992 | 7,249 | 46.17% | 5,153 | 32.82% | 3,298 | 21.01% |
| 1996 | 7,324 | 50.53% | 5,285 | 36.46% | 1,886 | 13.01% |
| 2000 | 10,408 | 65.21% | 5,073 | 31.78% | 480 | 3.01% |
| 2004 | 12,126 | 67.15% | 5,879 | 32.56% | 53 | 0.29% |
| 2008 | 11,745 | 62.70% | 6,621 | 35.35% | 365 | 1.95% |
| 2012 | 11,979 | 67.71% | 5,409 | 30.57% | 304 | 1.72% |
| 2016 | 14,494 | 72.96% | 4,539 | 22.85% | 833 | 4.19% |
| 2020 | 17,061 | 74.69% | 5,445 | 23.84% | 337 | 1.48% |
| 2024 | 17,627 | 75.96% | 5,368 | 23.13% | 211 | 0.91% |
| Year | Republican | Democratic | Third party(ies) | |||
|---|---|---|---|---|---|---|
| No. | % | No. | % | No. | % | |
| 2014 | 7,247 | 56.85% | 5,500 | 43.15% | 0 | 0.00% |
| 2018 | 10,586 | 66.57% | 5,037 | 31.68% | 278 | 1.75% |
| 2022 | 12,579 | 68.19% | 5,597 | 30.34% | 272 | 1.47% |
Voter registration
As of February 5, 2024,[update] there are 27,430 registered voters in the county. There are 18,231 registered Republicans, 6,414 registered Democrats, 2,138 voters registered non-affiliated voters, and 647 voters registered to other parties.
- Republican (66.5%)
- Democratic (23.4%)
- Independent (7.80%)
- Other Parties (2.36%)
County commissioners
- Scott Walls (chair) (R)
- Patrick Reeder (R)
- Jeffrey Thomas (D)
State Senate
State House of Representatives
Source:
- Scott Barger, Republican, Pennsylvania's 80th Representative District
- Rich Irvin, Republican, Pennsylvania's 81st Representative District
United States House of Representatives
United States Senate
| Year | Republican | Democratic | Third party(ies) | |||
|---|---|---|---|---|---|---|
| No. | % | No. | % | No. | % | |
| 2018 | 10,491 | 65.94% | 5,126 | 32.22% | 294 | 1.85% |
| 2024 | 16,910 | 72.02% | 5,582 | 23.78% | 986 | 4.20% |
| Year | Republican | Democratic | Third party(ies) | |||
|---|---|---|---|---|---|---|
| No. | % | No. | % | No. | % | |
| 2016 | 13,078 | 66.76% | 5,105 | 26.06% | 1,406 | 7.18% |
| 2022 | 13,035 | 71.37% | 4,665 | 25.54% | 564 | 3.09% |
Education
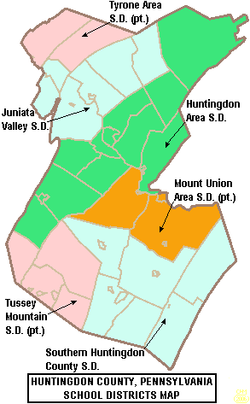
Public school districts

- Huntingdon Area School District
- Juniata Valley School District
- Mount Union Area School District (also in Mifflin County)
- Southern Huntingdon County School District
- Tussey Mountain School District (also in Bedford County)
- Tyrone Area School District (also in Blair and Centre Counties)
Related entities
- Huntingdon County Career and Technology Center: Mill Creek
- Tuscarora Intermediate Unit 11
Charter schools
- New Day Charter School (7–12): Huntingdon
- Stone Valley Community Charter School (K–5): McAlevy's Fort
Private schools
- Calvary Christian Academy(: Huntingdon
- Class School: Mill Creek
- Grier School: Birmingham
- Huntingdon Christian Academy: Huntingdon
- Huntingdon County Child & Adult Development Center
- Meadow Green Mennonite School: Three Springs
- Shavers Creek Christian School: Petersburg
- West Penn F Grace Brethren: Saxton
- Woodcock Valley Center on Children: Huntingdon

Colleges and universities
- Juniata College, a small, independent liberal arts college, is located in the county seat of Huntingdon.
- DuBois Business College, Huntingdon County campus, located in the former Huntingdon High School building in the borough of Huntingdon. (Currently Closed)
- Pennsylvania Highlands Community College, Huntingdon center (located in Walker Township)
Libraries
- Huntingdon County Library
- Memorial Public Library of the Borough of Alexandria
- Mount Union Community Library
Transportation
Major highways
- I-76 / Penna Turnpike
- US 22
- US 522
- PA 26
- PA 26 Truck
- PA 35
- PA 45
- PA 103
- PA 305
- PA 350
- PA 453
- PA 475
- PA 550
- PA 641
- PA 655
- PA 747
- PA 829
- PA 913
- PA 994
Media
Radio stations
AM
- ESPN RADIO 1150 AM: Huntingdon (Sports)
- WIEZ 670 AM: Lewistown (News/Talk)
- WMAJ 1450 AM: State College (Sports)
- WVAM 1430 AM: Altoona (Sports)
- WFBG 1290 AM: Altoona (News/Talk)
- WKMC 1370 AM: Roaring Spring (Nostalgia)
- WRTA 1240 AM: Altoona (News/Talk)
- WRSC 1390 AM: State College (News/Talk)
- WBLF 970 AM: Bellefonte (News/Talk)
- WPHB 1260 AM: Philipsburg (Country)
- WKVA 920 AM: Burnham (Oldies)
- WHP 580 AM: Harrisburg (News/Talk)
- KDKA 1020 AM: Pittsburgh (heard much better at night) (News/Talk)
- WWVA 1170 AM: Wheeling, West Virginia- (heard much better at night) (News/Talk/Country)
- WGY 810 AM: Schenectady, New York (heard much better at night) (News/Talk)
FM
- WHUN 103.5 FM: Huntingdon (Oldies)
- WDBF 106.3 FM: Selinsgrove (Country)
- WKVR 92.3 FM: Huntingdon (College)
- W273BE 102.5 FM: Huntingdon (Public Radio)
- WFGY 98.1 FM: Altoona (Country)
- WFGE 101.1 FM: Tyrone (Country)
- WBUS 93.7 FM: State College (Classic Rock)
- WWOT 100.1 FM: Altoona (Top 40)
- WJOW 105.9 FM: Philipsburg (Country)
- WSKE 104.3 FM: Everett (Country)
- WJSM 92.7 FM: Martinsburg (Religious)
- WHPA 93.5 FM: Gallitzin (Oldies)
- WBRX 94.7 FM: Cresson (Adult Contemporary)
- WRXV 89.1 FM: State College (Christian Contemporary)
- WTLR 89.9 FM: State College (Religious)
- WRKY 104.9 FM: Hollidaysburg (Classic Rock)
- WRKW 99.1 FM: Ebensburg (Classic Rock)
- WFGI 95.5 FM: Johnstown (Country)
- WVNW 96.7 FM: Burnham (Country)
- WCHX 105.5 FM: Burnham (Classic Rock)
- WQWK 103.1 FM: State College (Classic Rock)
- WLTS 99.5 FM: Centre Hall (Classic Hits)
- WPSU 91.5 FM: State College (Public Radio)
Newspapers
- The Daily News
Television
- CBS: WTAJ-TV, Altoona
- ABC: WATM-TV, Johnstown
- Fox: WWCP-TV, Johnstown
- NBC: WJAC-TV, Johnstown
- PBS: WPSU-TV, State College
- CW: WPKD-TV, Jeannette
Communities

Under Pennsylvania law, there are four types of incorporated municipalities: cities, boroughs, townships, and one town. The following boroughs and townships are located in Huntingdon County:
Boroughs
- Alexandria
- Birmingham
- Broad Top City
- Cassville
- Coalmont
- Dudley
- Huntingdon (county seat)
- Mapleton
- Marklesburg
- Mill Creek
- Mount Union
- Orbisonia
- Petersburg
- Rockhill
- Saltillo
- Shade Gap
- Shirleysburg
- Three Springs
Townships
- Barree
- Brady
- Carbon
- Cass
- Clay
- Cromwell
- Dublin
- Franklin
- Henderson
- Hopewell
- Jackson
- Juniata
- Lincoln
- Logan
- Miller
- Morris
- Oneida
- Penn
- Porter
- Shirley
- Smithfield
- Springfield
- Spruce Creek
- Tell
- Todd
- Union
- Walker
- Warriors Mark
- West
- Wood
Census-designated places
Unincorporated communities
Population ranking
The population ranking of the following table is based on the 2010 census of Huntingdon County.
† county seat
| Rank | City/Town/etc. | Municipal type | Population (2010 Census) |
|---|---|---|---|
| 1 | † Huntingdon | Borough | 7,093 |
| 2 | Mount Union | Borough | 2,447 |
| 3 | McConnellstown | CDP | 1,194 |
| 4 | Allenport | CDP | 648 |
| 5 | Petersburg | Borough | 480 |
| 6 | Broad Top City | Borough | 452 |
| 7 | Three Springs | Borough | 444 |
| 8 | Mapleton | Borough | 441 |
| 9 | Orbisonia | Borough | 428 |
| 10 | Rockhill | Borough | 371 |
| T-11 | Alexandria | Borough | 346 |
| T-11 | Saltillo | Borough | 346 |
| 12 | Mill Creek | Borough | 328 |
| 13 | Marklesburg | Borough | 204 |
| 14 | Dudley | Borough | 184 |
| 15 | Shirleysburg | Borough | 150 |
| 16 | Cassville | Borough | 143 |
| 17 | Coalmont | Borough | 106 |
| 18 | Shade Gap | Borough | 105 |
| 19 | Birmingham | Borough | 90 |
Notable people
- Scott Beatty (born 1969 in Huntingdon, raised in Petersburg), author and comic book writer
- Hugh Brady (born July 29, 1768, in Standingstone), U.S. Army general
- Martin Grove Brumbaugh (1862–1930), 26th Governor of Pennsylvania
- Dylan Lane (born 1977), game show host (hosted Chain Reaction) (born in Tyrone, Blair County, spent whole life in Huntingdon)
- Isabel Stewart North (1860-1929), composer
- Horace Porter (1837–1921), Civil War general and US diplomat
- John Purdue (born October 31, 1802, in Huntingdon County), primary original benefactor of Purdue University
- Richard Murray Simpson (1900–1960), US congressman, born in Huntingdon County
- Elizabeth Cisney Smith (1881–1965), physician
- Robert Elliott Speer (1867–1947), American religious leader
See also
External links
- at
40°25′N 77°59′W/40.41°N 77.98°W/ 40.41; -77.98