Demographics of Argentina
In-game article clicks load inline without leaving the challenge.
This is a demography of Argentina including population density, ethnicity, economic status, age and other aspects of the population.
As of the 2022census[INDEC], Argentina had a population of 46,044,703 – a 15.3% increase from the 40,117,096 counted in the 2010census[INDEC].
Argentina ranks third in South America in total population and 33rd globally. The country's population density is of 16.9 people per square kilometer of land area – well below the world average of 62 people. Argentina's population growth rate in 2023 was estimated to be 0.23% annually, with a birth rate of 9.9 per 1,000 inhabitants and a mortality rate of 7.6 per 1,000 inhabitants.
The proportion of people under 15, at 20%, is well below the world average (25%), and the cohort of people 65 and older is relatively high, at 12%. The percentage of senior citizens in Argentina has long been second only to Uruguay in Latin America and well above the world average, which is currently 9.8%.
The median age is approximately 34 years, and life expectancy at birth is of 78 years. According to an official cultural consumption survey conducted in 2006, 42.3% of Argentines speak English (though only 15.4% of those claimed to have a high level of English comprehension), 9.3% speak Portuguese and 5.9% speak Italian.
Population size and structure
| Year | Pop. | ±% p.a. |
|---|---|---|
| 1650 | 298,000 | — |
| 1778 | 420,900 | +0.27% |
| 1800 | 551,500 | +1.24% |
| 1809 | 609,200 | +1.11% |
| 1825 | 766,400 | +1.45% |
| 1839 | 926,300 | +1.36% |
| 1857 | 1,299,600 | +1.90% |
| 1869 | 1,830,214 | +2.89% |
| 1895 | 4,044,911 | +3.10% |
| 1914 | 7,903,662 | +3.59% |
| 1947 | 15,893,811 | +2.14% |
| 1960 | 20,013,793 | +1.79% |
| 1970 | 23,364,431 | +1.56% |
| 1980 | 27,949,480 | +1.81% |
| 1991 | 32,615,528 | +1.41% |
| 2001 | 36,260,130 | +1.06% |
| 2010 | 40,117,096 | +1.13% |
| 2022 | 46,044,703 | +1.16% |
| Source: |
Sources: Pantelides and National Institute of Statistics and Census of Argentina
| Years | Total fertility rates (children/woman) | Crude birth rates | Age 0–14 | Age 15–29 | Age 30–44 | Age 45–59 | Age 60–74 | Age 75+ |
|---|---|---|---|---|---|---|---|---|
| 1869 | 6.8 | 49.1 | 45.3% | 29.7% | 16.0% | 7.0% | 1.8% | 0.2% |
| 1895 | 7.0 | 44.5 | 40.3% | 27.7% | 19.5% | 8.9% | 2.9% | 0.7% |
| 1914 | 5.2 | 36.5 | 38.4% | 30.8% | 17.9% | 8.9% | 3.3% | 0.7% |
| 1947 | 3.2 | 24.7 | 30.8% | 27.5% | 21.5% | 13.6% | 5.5% | 1.1% |
| 1960 | 3.1 | 22.9 | 30.8% | 23.8% | 21.2% | 15.3% | 7.3% | 1.6% |
| 1970 | 3.1 | 22.7 | 29.3% | 24.6% | 19.9% | 15.4% | 8.6% | 2.2% |
| 1980 | 3.4 | 24.8 | 30.4% | 23.9% | 18.8% | 15.1% | 9.0% | 2.8% |
| 1991 | 2.9 | 21.1 | 30.6% | 23.3% | 19.3% | 13.9% | 9.6% | 3.3% |
| 2001 | 2.6 | 18.4 | 28.3% | 25.0% | 18.6% | 14.7% | 9.3% | 4.1% |
| 2010 | 2.4 | 18.5 | 25.5% | 24.8% | 20.2% | 15.2% | 9.8% | 4.5% |
| 2022 | 1.4 | 10.7 | 22.0% | 23.3% | 22.1% | 16.4% | 11.2% | 5.0% |
Cities
- Buenos Aires (35.8%)
- Córdoba (4.06%)
- Rosario (3.34%)
- Mendoza (2.72%)
- Tucumán (2.35%)
- Rest of Argentina (51.7%)
Argentina is highly urbanized, with the ten largest metropolitan areas accounting for half of the population, and fewer than one in ten living in rural areas. About 3million people live in Buenos Aires proper, and including suburban Greater Buenos Aires the metropolitan area totals around 14million – making it one of the 15 largest urban areas in the world. The metropolitan areas of Córdoba and Rosario have around 1.3million inhabitants each, and six other cities (Mendoza, Tucumán, La Plata, Mar del Plata, Salta and Santa Fe) have at least half a million people each.
The population is unequally distributed amongst the provinces, with 61% living in the Pampa region (21% of the total area), including 17.5million people in Buenos Aires Province, 4million in Córdoba Province, and over 3million each in Santa Fe Province and the Autonomous City of Buenos Aires. Eight other provinces each have over one million people: Mendoza, Tucumán, Salta, Entre Ríos, Misiones, Corrientes, Chaco, and Santiago del Estero. Tucumán is the most densely populated (with 75 inhabitants/km2, the only Argentine province more densely populated than the world average), while the southern province of Santa Cruz has just 1.4 inhabitant/km2.
In the mid-19th century, a large wave of immigration started to arrive to Argentina due to new constitutional policies that encouraged immigration, and issues in the countries the immigrants came from such as wars, poverty, hunger, famines, pursuit of a better life, among other reasons. The main immigration sources were from Europe, the countries from the Near and Middle East, Russia and Japan. In fact, the immigration torrent was so strong that Argentina eventually received the second-largest number of immigrants in the world, second only to the US and ahead of such immigrant receptor countries such as Canada, Brazil, Australia, etc.

Most of these European immigrants settled in the cities which offered jobs, education and other opportunities enabling them to enter the middle class. Many also settled in the growing small towns along the expanding railway system and since the 1930s many rural workers have moved to the big cities.
Urban areas reflect the influence of European immigration, and most of the larger ones feature boulevards and diagonal avenues inspired by the redevelopment of Paris. Argentine cities were originally built in a colonial Spanish grid style, centered on a plaza overlooked by a cathedral and important government buildings. Many still retain this general layout, known as a damero, meaning checkerboard, since it is based on a pattern of square blocks. The city of La Plata, designed at the end of the 19th century by Pedro Benoit, combines the checkerboard layout with added diagonal avenues at fixed intervals, and was the first in South America with electric street lighting.
Provinces and districts
a Not including claims to the Islas Malvinas (Falkland Islands) and South Georgia and the South Sandwich Islands.
- Population pyramid of each province in 2022
- National pyramid
- Buenos Aires
- Córdoba
- Santa Fe
- Buenos Aires City
- Misiones
- Chaco
- Santiago del Estero
- Neuquén
- Formosa
- Santa Cruz
- Tierra del Fuego
Structure of the population
According to the 2022 revision of theWorld Population Prospects the total population was 45,276,780 in 2021 – double the number in 1966 (for a 1.27% average annual growth rate in that period). The population below the age of 15 in 2022 was 22%, 66% was between 15 and 64, while 12% was 65 or older.
| Year | Total population | Population percentage in age bracket | ||
|---|---|---|---|---|
| aged 0–14 | aged 15–64 | aged 65+ | ||
| 1950 | 17 150 000 | 31.2% | 64.6% | 4.2% |
| 1955 | 18 928 000 | 31.3% | 63.9% | 4.8% |
| 1960 | 20 616 000 | 30.8% | 63.6% | 5.6% |
| 1965 | 22 283 000 | 30.2% | 63.6% | 6.2% |
| 1970 | 23 963 000 | 29.3% | 63.7% | 7.0% |
| 1975 | 26 049 000 | 29.4% | 63.0% | 7.6% |
| 1980 | 28 094 000 | 30.4% | 61.4% | 8.2% |
| 1985 | 30 305 000 | 31.0% | 60.5% | 8.5% |
| 1990 | 32 527 000 | 30.7% | 60.4% | 8.9% |
| 1995 | 34 768 000 | 29.6% | 61.0% | 9.4% |
| 2000 | 36 784 000 | 28.5% | 61.8% | 9.7% |
| 2005 | 38 592 000 | 27.3% | 62.8% | 9.9% |
| 2010 | 40 788 000 | 25.5% | 64.3% | 10.2% |
| 2015 | 43 132 000 | 25.2% | 64.1% | 10.7% |
| 2020 | 45 377 000 | 23.6% | 65.0% | 11.4% |
| 2025 | 47 011 000 | 20.1% | 67.7% | 12.2% |
| Age group | Male | Female | Total | % |
|---|---|---|---|---|
| Total | 22 182 317 | 23 704 263 | 45 886 580 | 100 |
| 0–4 | 1 442 339 | 1 404 211 | 2 846 550 | 6.20 |
| 5–9 | 1 825 647 | 1 773 600 | 3 599 247 | 7.84 |
| 10–14 | 1 845 146 | 1 788 414 | 3 633 560 | 7.92 |
| 15–19 | 1 800 681 | 1 768 387 | 3 569 068 | 7.78 |
| 20–24 | 1 757 472 | 1 779 791 | 3 537 263 | 7.71 |
| 25–29 | 1 755 496 | 1 824 075 | 3 579 571 | 7.80 |
| 30–34 | 1 706 782 | 1 787 492 | 3 494 274 | 7.62 |
| 35–39 | 1 616 211 | 1 692 147 | 3 308 358 | 7.21 |
| 40–44 | 1 617 796 | 1 713 874 | 3 331 670 | 7.26 |
| 45–49 | 1 386 629 | 1 488 369 | 2 874 998 | 6.27 |
| 50–54 | 1 177 301 | 1 281 024 | 2 458 325 | 5.36 |
| 55–59 | 1 044 857 | 1 158 048 | 2 202 905 | 4.80 |
| 60–64 | 929 041 | 1 057 693 | 1 986 734 | 4.33 |
| 65–69 | 796 143 | 946 014 | 1 742 157 | 3.80 |
| 70–74 | 627 993 | 799 212 | 1 427 205 | 3.11 |
| 75–79 | 424 945 | 611 035 | 1 035 980 | 2.26 |
| 80+ | 427 838 | 830 877 | 1 258 715 | 2.74 |
| Age group | Male | Female | Total | Percent |
| 0–14 | 5 113 132 | 4 966 225 | 10 079 357 | 21.97 |
| 15–64 | 14 792 266 | 15 550 900 | 30 343 166 | 66.12 |
| 65+ | 2 276 919 | 3 187 138 | 5 464 057 | 11.91 |
| Age group | Male | Female | Total | % |
|---|---|---|---|---|
| Total | 19 523 766 | 20 593 330 | 40 117 096 | 100 |
| 0–4 | 1 697 972 | 1 639 680 | 3 337 652 | 8.32 |
| 5–9 | 1 717 752 | 1 663 467 | 3 381 219 | 8.43 |
| 10–14 | 1 779 372 | 1 724 074 | 3 503 446 | 8.73 |
| 15–19 | 1 785 061 | 1 757 006 | 3 542 067 | 8.83 |
| 20–24 | 1 648 456 | 1 651 693 | 3 300 149 | 8.23 |
| 25–29 | 1 552 106 | 1 578 403 | 3 130 509 | 7.80 |
| 30–34 | 1 523 342 | 1 575 371 | 3 098 713 | 7.72 |
| 35–39 | 1 311 528 | 1 366 907 | 2 678 435 | 6.68 |
| 40–44 | 1 125 887 | 1 184 888 | 2 310 775 | 5.76 |
| 45–49 | 1 067 468 | 1 128 882 | 2 196 350 | 5.48 |
| 50–54 | 986 196 | 1 056 797 | 2 042 993 | 5.09 |
| 55–59 | 893 570 | 975 380 | 1 868 950 | 4.66 |
| 60–64 | 760 914 | 860 276 | 1 621 190 | 4.04 |
| 65–69 | 588 569 | 704 492 | 1 293 061 | 3.22 |
| 70–74 | 438 438 | 577 459 | 1 015 897 | 2.53 |
| 75–79 | 321 481 | 480 178 | 801 659 | 2.00 |
| 80+ | 325 654 | 668 377 | 994 031 | 2.48 |
| Age group | Male | Female | Total | Percent |
| 0–14 | 5 195 096 | 5 027 221 | 10 222 317 | 25.48 |
| 15–64 | 12 654 528 | 13 135 603 | 25 790 131 | 64.29 |
| 65+ | 1 674 142 | 2 430 506 | 4 104 648 | 10.23 |
Vital statistics
The table below gives an overview of the number of birth and deaths in Argentina during the past century. Several sources were combined to compile the table.
The number of births in 2023 (460,902) was 41% below the record set in 2014, while the number of deaths was 353,428. As the population of Argentina showed a five-fold increase during the past century, the birth rate in 2023 (9.9) was a record low – now comparable to most European countries.
Death rates declined rapidly in the half century until around 1940 – then more gradually as the country's population aged. The death rate in 2023 (7.6) was near historic lows after having briefly risen in 2021 to the highest rate (9.5) since 1947 due to the COVID-19 pandemic.
Birth rates were relatively stable from 1934 through 1980, and after declining stabilized from 1995 to 2015 – before again declining sharply since then.
| Average population (June 30) | Live births | Deaths | Natural change | Crude birth rate (per 1000) | Crude death rate (per 1000) | Natural change (per 1000) | Crude migration (per 1000) | Total fertility rate | Infant mortality rate | |
|---|---|---|---|---|---|---|---|---|---|---|
| 1910 | 6,800,000 | 260,000 | 129,000 | 131,000 | 38.3 | 18.9 | 19.4 | 5.26 | ||
| 1911 | 7,070,000 | 268,000 | 129,000 | 139,000 | 37.9 | 18.2 | 19.7 | 19.3 | 5.24 | 148.0 |
| 1912 | 7,470,000 | 288,000 | 127,000 | 161,000 | 38.6 | 17.0 | 21.6 | 33.8 | 5.43 | 143.0 |
| 1913 | 7,840,000 | 298,000 | 127,000 | 171,000 | 38.0 | 16.2 | 21.8 | 26.6 | 5.42 | 130.0 |
| 1914 | 8,000,000 | 294,000 | 123,000 | 171,000 | 36.7 | 15.4 | 21.3 | −1.4 | 5.16 | 125.0 |
| 1915 | 8,150,000 | 288,000 | 129,000 | 159,000 | 35.3 | 15.8 | 19.5 | −1.1 | 4.94 | 124.0 |
| 1916 | 8,300,000 | 293,000 | 142,000 | 151,000 | 35.3 | 17.1 | 18.2 | −0.1 | 4.90 | 124.0 |
| 1917 | 8,450,000 | 284,000 | 136,000 | 148,000 | 33.6 | 16.1 | 17.5 | 0,2 | 4.64 | 128.0 |
| 1918 | 8,600,000 | 283,000 | 157,000 | 126,000 | 32.9 | 18.2 | 14.7 | 2.8 | 4.51 | 138.0 |
| 1919 | 8,750,000 | 286,000 | 161,000 | 125,000 | 32.7 | 18.4 | 14.3 | 2.9 | 4.45 | 134.0 |
| 1920 | 8,970,000 | 290,000 | 139,000 | 151,000 | 32.3 | 15.5 | 16.8 | 7.9 | 4.40 | 127.0 |
| 1921 | 9,220,000 | 302,000 | 146,000 | 156,000 | 32.8 | 15.8 | 17.0 | 10.5 | 4.47 | 116.0 |
| 1922 | 9,520,000 | 315,000 | 133,000 | 182,000 | 33.1 | 14.0 | 19.1 | 12.8 | 4.55 | 112.0 |
| 1923 | 9,890,000 | 336,000 | 146,000 | 190,000 | 34.0 | 14.8 | 19.2 | 18.9 | 4.74 | 112.0 |
| 1924 | 10,220,000 | 335,000 | 146,000 | 189,000 | 32.8 | 14.3 | 18.5 | 14.3 | 4.61 | 116.0 |
| 1925 | 10,500,000 | 334,000 | 148,000 | 186,000 | 31.8 | 14.1 | 17.7 | 9.2 | 4.49 | 121.0 |
| 1926 | 10,800,000 | 337,000 | 147,000 | 190,000 | 31.2 | 13.6 | 17.6 | 10.5 | 4.42 | 119.0 |
| 1927 | 11,130,000 | 342,000 | 157,000 | 185,000 | 30.7 | 14.1 | 16.6 | 13.4 | 4.38 | 126.0 |
| 1928 | 11,440,000 | 352,000 | 151,000 | 201,000 | 30.8 | 13.2 | 17.6 | 9.8 | 4.40 | 113.0 |
| 1929 | 11,750,000 | 355,000 | 162,000 | 193,000 | 30.2 | 13.8 | 16.4 | 10.3 | 4.33 | 107.0 |
| 1930 | 12,050,000 | 355,000 | 153,000 | 202,000 | 29.5 | 12.7 | 16.8 | 8.3 | 4.22 | 100.0 |
| 1931 | 12,290,000 | 350,000 | 156,000 | 194,000 | 28.5 | 12.7 | 15.8 | 3.8 | 4.07 | 100.0 |
| 1932 | 12,520,000 | 352,000 | 139,000 | 213,000 | 28.1 | 11.1 | 17.0 | 1.4 | 3.99 | 95.0 |
| 1933 | 12,730,000 | 332,000 | 150,000 | 182,000 | 26.1 | 11.8 | 14.3 | 2.2 | 3.67 | 87.0 |
| 1934 | 12,940,000 | 319,661 | 143,065 | 176,596 | 24.7 | 11.1 | 13.6 | 2.6 | 3.45 | 96.6 |
| 1935 | 13,150,000 | 322,002 | 162,768 | 159,234 | 24.5 | 12.4 | 12.1 | 3.9 | 3.39 | 105.6 |
| 1936 | 13,370,000 | 318,651 | 150,092 | 168,559 | 23.8 | 11.2 | 12.6 | 3.9 | 3.28 | 96.2 |
| 1937 | 13,610,000 | 319,024 | 154,275 | 164,749 | 23.4 | 11.3 | 12.1 | 5.6 | 3.20 | 95.4 |
| 1938 | 14,202,000 | 325,412 | 161,555 | 163,857 | 22.9 | 11.4 | 11.5 | 31.5 | 3.19 | 105.3 |
| 1939 | 14,397,000 | 329,393 | 149,153 | 180,240 | 22.9 | 10.4 | 12.5 | 1.0 | 3.14 | 91.7 |
| 1940 | 14,591,000 | 339,029 | 151,856 | 187,173 | 23.2 | 10.4 | 12.8 | 0.5 | 3.18 | 90.2 |
| 1941 | 14,796,000 | 340,339 | 148,947 | 191,392 | 23.0 | 10.1 | 12.9 | 0.9 | 3.11 | 84.8 |
| 1942 | 15,004,000 | 338,199 | 150,030 | 188,169 | 22.5 | 10.0 | 12.5 | 1.3 | 3.03 | 86.1 |
| 1943 | 15,216,000 | 358,977 | 150,166 | 208,811 | 23.6 | 9.9 | 13.7 | 0.2 | 3.12 | 79.8 |
| 1944 | 15,441,000 | 380,950 | 154,093 | 226,857 | 24.7 | 10.0 | 14.7 | −0.1 | 3.23 | 80.7 |
| 1945 | 15,674,000 | 388,191 | 157,785 | 230,406 | 24.8 | 10.1 | 14.7 | 0.2 | 3.21 | 82.1 |
| 1946 | 15,912,000 | 387,496 | 149,895 | 237,601 | 24.4 | 9.4 | 14.9 | 0 | 3.12 | 79.0 |
| 1947 | 16,109,000 | 398,468 | 158,059 | 240,409 | 24.7 | 9.7 | 15.0 | −2.7 | 3.14 | 77.1 |
| 1948 | 16,284,000 | 413,132 | 152,648 | 260,484 | 25.4 | 9.4 | 16.0 | −5.3 | 3.19 | 69.5 |
| 1949 | 16,671,000 | 419,656 | 150,604 | 269,052 | 25.2 | 9.0 | 16.1 | 7.2 | 3.18 | 67.0 |
| 1950 | 17,150,000 | 438,766 | 154,540 | 284,226 | 25.6 | 9.0 | 16.6 | 11.7 | 3.26 | 68.2 |
| 1951 | 17,506,000 | 444,326 | 156,406 | 287,920 | 25.4 | 9.0 | 16.5 | 4.0 | 3.26 | 67.4 |
| 1952 | 17,865,000 | 446,156 | 153,887 | 292,269 | 25.0 | 8.6 | 16.4 | 3.8 | 3.22 | 64.3 |
| 1953 | 18,224,000 | 459,734 | 162,217 | 297,517 | 25.3 | 8.9 | 16.4 | 3.4 | 3.27 | 63.8 |
| 1954 | 18,580,000 | 457,559 | 156,347 | 301,212 | 24.6 | 8.4 | 16.2 | 3.0 | 3.21 | 60.4 |
| 1955 | 18,931,000 | 461,293 | 167,357 | 293,936 | 24.4 | 8.8 | 15.5 | 3.1 | 3.20 | 61.8 |
| 1956 | 19,277,000 | 474,142 | 161,321 | 312,821 | 24.6 | 8.4 | 16.2 | 1.8 | 3.24 | 57.0 |
| 1957 | 19,618,000 | 478,368 | 179,578 | 298,790 | 24.4 | 9.2 | 15.2 | 2.2 | 3.24 | 68.5 |
| 1958 | 19,955,000 | 472,865 | 166,235 | 306,630 | 23.7 | 8.3 | 15.4 | 1.5 | 3.16 | 61.4 |
| 1959 | 20,291,000 | 476,211 | 173,409 | 302,802 | 23.5 | 8.5 | 14.9 | 1.7 | 3.15 | 59.1 |
| 1960 | 20,625,000 | 473,038 | 179,266 | 293,772 | 22.9 | 8.7 | 14.2 | 2.0 | 3.08 | 62.4 |
| 1961 | 20,961,000 | 476,259 | 176,477 | 299,782 | 22.7 | 8.4 | 14.3 | 1.8 | 3.06 | 59.1 |
| 1962 | 21,297,000 | 490,414 | 184,013 | 306,401 | 23.0 | 8.6 | 14.4 | 1.4 | 3.11 | 58.7 |
| 1963 | 21,633,000 | 491,109 | 187,492 | 303,617 | 22.7 | 8.7 | 14.0 | 1.5 | 3.07 | 61.8 |
| 1964 | 21,966,000 | 496,256 | 193,141 | 303,115 | 22.6 | 8.8 | 13.8 | 1.4 | 3.05 | 58.3 |
| 1965 | 22,297,000 | 481,814 | 196,467 | 285,347 | 21.6 | 8.8 | 12.8 | 2.1 | 2.92 | 56.9 |
| 1966 | 22,622,000 | 479,396 | 194,450 | 284,946 | 21.2 | 8.6 | 12.6 | 1.8 | 2.87 | 53.4 |
| 1967 | 22,945,000 | 480,317 | 195,265 | 285,052 | 20.9 | 8.5 | 12.4 | 1.7 | 2.84 | 55.0 |
| 1968 | 23,273,000 | 493,354 | 213,313 | 280,041 | 21.2 | 9.2 | 12.0 | 2.1 | 2.87 | 59.9 |
| 1969 | 23,617,000 | 580,699 | 222,937 | 357,762 | 24.6 | 9.4 | 15.2 | −0.6 | 3.34 | 52.5 |
| 1970 | 23,983,000 | 544,521 | 222,113 | 322,408 | 22.7 | 9.3 | 13.5 | 1.8 | 3.09 | 59.1 |
| 1971 | 24,376,000 | 564,787 | 225,256 | 339,531 | 23.2 | 9.2 | 14.0 | 2.2 | 3.16 | 61.1 |
| 1972 | 24,792,000 | 559,398 | 223,063 | 336,335 | 22.6 | 9.0 | 13.6 | 3.1 | 3.09 | 56.7 |
| 1973 | 25,222,000 | 569,469 | 228,508 | 340,961 | 22.6 | 9.1 | 13.5 | 3.8 | 3.06 | 55.4 |
| 1974 | 25,654,000 | 601,213 | 230,796 | 370,417 | 23.4 | 9.0 | 14.4 | 2.4 | 3.24 | 49.3 |
| 1975 | 26,079,000 | 619,945 | 229,291 | 390,654 | 23.8 | 8.8 | 15.0 | 1.3 | 3.29 | 43.2 |
| 1976 | 26,493,000 | 656,768 | 240,764 | 416,004 | 24.8 | 9.1 | 15.7 | −0.1 | 3.44 | 44.4 |
| 1977 | 26,899,000 | 661,222 | 234,430 | 426,792 | 24.6 | 8.7 | 15.9 | −0.8 | 3.43 | 44.5 |
| 1978 | 27,303,000 | 665,450 | 233,482 | 431,968 | 24.4 | 8.6 | 15.8 | −1.0 | 3.41 | 40.8 |
| 1979 | 27,712,000 | 647,864 | 234,926 | 412,938 | 23.4 | 8.5 | 14.9 | −0.1 | 3.29 | 38.5 |
| 1980 | 28,131,000 | 697,775 | 241,125 | 456,650 | 24.8 | 8.6 | 16.3 | −1.4 | 3.49 | 33.2 |
| 1981 | 28,562,000 | 680,292 | 241,904 | 438,388 | 23.8 | 8.5 | 15.4 | −0.3 | 3.37 | 33.6 |
| 1982 | 29,001,000 | 663,429 | 234,926 | 428,503 | 22.9 | 8.1 | 14.8 | 0.3 | 3.24 | 30.5 |
| 1983 | 29,448,000 | 655,876 | 233,071 | 422,805 | 22.3 | 7.9 | 14.4 | 0.8 | 3.15 | 29.7 |
| 1984 | 29,900,000 | 635,323 | 255,591 | 379,732 | 21.3 | 8.6 | 12.7 | 2.5 | 3.00 | 30.4 |
| 1985 | 30,354,000 | 650,783 | 241,377 | 409,406 | 21.5 | 8.0 | 13.5 | 1.5 | 3.02 | 26.2 |
| 1986 | 30,811,000 | 675,388 | 241,004 | 434,384 | 22.0 | 7.8 | 14.1 | 0.7 | 3.08 | 26.9 |
| 1987 | 31,270,000 | 668,136 | 249,882 | 418,254 | 21.4 | 8.0 | 13.4 | 1.3 | 2.99 | 26.6 |
| 1988 | 31,729,000 | 680,605 | 254,953 | 425,652 | 21.5 | 8.1 | 13.5 | 1.1 | 3.00 | 25.8 |
| 1989 | 32,187,000 | 667,058 | 252,302 | 414,756 | 20.8 | 7.9 | 12.9 | 1.4 | 2.89 | 25.7 |
| 1990 | 32,642,000 | 678,644 | 259,683 | 418,961 | 20.9 | 8.0 | 12.9 | 1.1 | 2.89 | 25.6 |
| 1991 | 33,094,000 | 694,776 | 255,609 | 439,167 | 21.0 | 7.7 | 13.3 | 0.4 | 2.91 | 24.7 |
| 1992 | 33,540,000 | 678,761 | 262,287 | 416,474 | 20.2 | 7.8 | 12.4 | 0.9 | 2.79 | 23.9 |
| 1993 | 33,982,000 | 667,518 | 267,286 | 400,232 | 19.6 | 7.9 | 11.8 | 1.2 | 2.70 | 22.9 |
| 1994 | 34,420,000 | 673,787 | 257,431 | 416,356 | 19.6 | 7.5 | 12.1 | 0.6 | 2.68 | 22.0 |
| 1995 | 34,855,000 | 658,735 | 268,997 | 389,738 | 18.9 | 7.7 | 11.2 | 1.3 | 2.58 | 22.2 |
| 1996 | 35,287,000 | 675,437 | 268,715 | 406,722 | 19.1 | 7.6 | 11.5 | 0.7 | 2.60 | 20.9 |
| 1997 | 35,715,000 | 692,357 | 270,910 | 421,447 | 19.4 | 7.6 | 11.8 | 0.2 | 2.63 | 18.8 |
| 1998 | 36,135,000 | 683,301 | 280,180 | 403,121 | 18.9 | 7.8 | 11.2 | 0.5 | 2.56 | 19.1 |
| 1999 | 36,541,000 | 686,748 | 289,543 | 397,205 | 18.8 | 7.9 | 10.9 | 0.2 | 2.54 | 17.6 |
| 2000 | 36,931,000 | 701,878 | 277,148 | 424,730 | 19.0 | 7.5 | 11.5 | −1.0 | 2.57 | 16.6 |
| 2001 | 37,302,000 | 683,495 | 285,941 | 397,554 | 18.3 | 7.7 | 10.7 | −0.7 | 2.50 | 16.3 |
| 2002 | 37,657,000 | 694,684 | 291,190 | 403,494 | 18.4 | 7.7 | 10.7 | −1.3 | 2.48 | 16.8 |
| 2003 | 38,001,000 | 697,952 | 302,064 | 395,888 | 18.4 | 7.9 | 10.4 | −1.4 | 2.46 | 16.5 |
| 2004 | 38,341,000 | 736,261 | 294,051 | 442,210 | 19.2 | 7.7 | 11.5 | −2.7 | 2.57 | 14.4 |
| 2005 | 38,681,000 | 712,220 | 293,529 | 427,691 | 18.6 | 7.6 | 11.1 | −2.3 | 2.45 | 13.3 |
| 2006 | 39,024,000 | 696,451 | 292,313 | 404,138 | 17.8 | 7.5 | 10.4 | −1.6 | 2.37 | 12.9 |
| 2007 | 39,368,000 | 700,792 | 315,852 | 384,940 | 17.8 | 8.0 | 9.8 | −1.0 | 2.36 | 13.3 |
| 2008 | 39,714,000 | 746,460 | 301,801 | 444,659 | 18.8 | 7.6 | 11.2 | −2.5 | 2.49 | 12.5 |
| 2009 | 40,134,400 | 745,336 | 304,525 | 440,811 | 18.6 | 7.6 | 11.0 | −0.5 | 2.46 | 12.1 |
| 2010 | 40,518,851 | 756,176 | 318,602 | 437,574 | 18.5 | 7.8 | 10.7 | −1.3 | 2.47 | 11.9 |
| 2011 | 40,900,496 | 758,042 | 319,059 | 438,983 | 18.4 | 7.7 | 10.7 | −1.4 | 2.45 | 11.7 |
| 2012 | 41,281,631 | 738,318 | 319,539 | 418,779 | 18.0 | 7.7 | 10.2 | −0.9 | 2.28 | 11.1 |
| 2013 | 42,203,000 | 754,603 | 326,197 | 428,406 | 17.9 | 7.7 | 10.2 | 11.9 | 2.28 | 10.8 |
| 2014 | 42,669,500 | 777,012 | 325,539 | 451,437 | 18.2 | 7.6 | 10.6 | 0.4 | 2.33 | 10.6 |
| 2015 | 43,132,000 | 770,040 | 333,407 | 436,633 | 17.9 | 7.7 | 10.2 | 0.6 | 2.24 | 9.7 |
| 2016 | 43,590,000 | 728,035 | 352,992 | 375,043 | 16.7 | 8.2 | 8.5 | 1.9 | 2.13 | 9.7 |
| 2017 | 44,044,811 | 704,609 | 341,668 | 362,941 | 15.9 | 7.8 | 8.1 | 2.1 | 2.06 | 9.3 |
| 2018 | 44,494,502 | 685,394 | 336,823 | 348,571 | 15.4 | 7.6 | 7.8 | 2.3 | 2.00 | 8.8 |
| 2019 | 44,938,712 | 625,441 | 341,728 | 283,713 | 13.9 | 7.6 | 6.3 | 3.6 | 1.81 | 9.2 |
| 2020 | 45,376,763 | 533,299 | 376,219 | 157,080 | 11.8 | 8.3 | 3.5 | 6.3 | 1.61 | 8.4 |
| 2021 | 45,808,747 | 529,794 | 436,799 | 92,995 | 11.6 | 9.5 | 2.1 | 7.5 | 1.48 | 8.0 |
| 2022 | 46,044,703 | 495,295 | 397,115 | 98,180 | 10.7 | 8.6 | 2.1 | 3.0 | 1.39 | 8.4 |
| 2023 | 46,654,581 | 460,902 | 353,428 | 107,474 | 9.9 | 7.6 | 2.3 | 10.9 | 1.33 | 8.0 |
| 2024 | 47,067,000 | 413,135 | 376,405 | 36,730 | 8.9 | 8.1 | 0.8 | 8.0 | 1.23 | 8.5 |
Total fertility rate
By province

Total fertility rate (TFR) in Argentina by province as of 2023:
| province | TFR |
|---|---|
| Misiones | 1.82 |
| Formosa | 1.71 |
| Chaco | 1.69 |
| San Juan | 1.62 |
| Corrientes | 1.59 |
| Santiago del Estero | 1.48 |
| Salta | 1.47 |
| Santa Fe | 1.43 |
| Neuquén | 1.37 |
| Tucumán | 1.36 |
| Entre Ríos | 1.35 |
| Mendoza | 1.34 |
| Argentina | 1.33 |
| Córdoba | 1.33 |
| Catamarca | 1.32 |
| Río Negro Province | 1.30 |
| La Rioja Province | 1.26 |
| San Luis Province | 1.25 |
| La Pampa | 1.24 |
| Buenos Aires Province | 1.23 |
| Jujuy | 1.21 |
| Chubut | 1.14 |
| Buenos Aires | 1.10 |
| Santa Cruz | 1.05 |
| Tierra del Fuego | 0.98 |
Before 1910
| Years | 1869 | 1870 | 1871 | 1872 | 1873 | 1874 | 1875 | 1876 | 1877 | 1878 |
|---|---|---|---|---|---|---|---|---|---|---|
| Total Fertility Rate in Argentina | 6.80 | 6.73 | 6.65 | 6.58 | 6.58 | 6.57 | 6.57 | 6.57 | 6.57 | 6.56 |
| Years | 1879 | 1880 | 1881 | 1882 | 1883 | 1884 | 1885 | 1886 | 1887 | 1888 |
|---|---|---|---|---|---|---|---|---|---|---|
| Total Fertility Rate in Argentina | 6.56 | 6.56 | 6.56 | 6.55 | 6.47 | 6.39 | 6.30 | 6.22 | 6.14 | 6.09 |
| Years | 1889 | 1890 | 1891 | 1892 | 1893 | 1894 | 1895 | 1896 | 1897 | 1898 |
|---|---|---|---|---|---|---|---|---|---|---|
| Total Fertility Rate in Argentina | 6.04 | 5.99 | 5.94 | 5.90 | 6.26 | 6.63 | 7.00 | 6.48 | 5.96 | 5.96 |
| Years | 1899 | 1900 | 1901 | 1902 | 1903 | 1904 | 1905 | 1906 | 1907 | 1908 |
|---|---|---|---|---|---|---|---|---|---|---|
| Total Fertility Rate in Argentina | 5.95 | 5.95 | 5.94 | 5.94 | 5.88 | 5.82 | 5.76 | 5.70 | 5.64 | 5.56 |
| Years | 1909 |
|---|---|
| Total Fertility Rate in Argentina | 5.49 |
UN estimates
The Population Department of the United Nations prepared the following estimates of vital statistics of Argentina.
| Period | Live births per year | Deaths per year | Natural change per year | CBR* | CDR* | NC* | TFR* | IMR* | Life expectancy | ||
|---|---|---|---|---|---|---|---|---|---|---|---|
| total | males | females | |||||||||
| 1950–1954 | 449,300 | 156,700 | 292,600 | 25.1 | 8.8 | 16.3 | 3.24 | 64.8 | 62.5 | 60.4 | 65.1 |
| 1955–1959 | 472,600 | 169,600 | 303,000 | 24.1 | 8.6 | 15.5 | 3.20 | 61.6 | 64.5 | 62.1 | 67.4 |
| 1960–1964 | 485,400 | 184,100 | 301,300 | 22.8 | 8.6 | 14.2 | 3.07 | 60.1 | 65.2 | 62.4 | 68.6 |
| 1965–1969 | 503,100 | 204,500 | 298,600 | 21.9 | 8.9 | 13.0 | 2.97 | 55.5 | 65.7 | 62.7 | 69.3 |
| 1970–1974 | 566,500 | 224,800 | 341,700 | 22.8 | 9.1 | 13.7 | 3.13 | 50.2 | 67.2 | 64.1 | 70.7 |
| 1975–1979 | 650,200 | 234,500 | 415,700 | 24.2 | 8.7 | 15.5 | 3.37 | 42.4 | 68.6 | 65.4 | 72.2 |
| 1980–1984 | 666,500 | 241,300 | 425,200 | 23.0 | 8.3 | 14.7 | 3.25 | 31.5 | 70.1 | 66.8 | 73.7 |
| 1985–1989 | 668,400 | 247,900 | 420,500 | 21.4 | 7.9 | 13.5 | 3.00 | 26.2 | 71.0 | 67.5 | 74.6 |
| 1990–1994 | 678,700 | 260,500 | 418,200 | 20.2 | 7.8 | 12.4 | 2.79 | 23.8 | 72.1 | 68.6 | 75.8 |
| 1995–1999 | 679,300 | 275,700 | 403,600 | 19.0 | 7.7 | 11.3 | 2.58 | 19.7 | 73.2 | 69.6 | 76.9 |
| 2000–2004 | 702,900 | 290,100 | 412,800 | 18.7 | 7.7 | 11.0 | 2.52 | 16.1 | 74.3 | 70.6 | 78.1 |
| 2005–2009 | 720,300 | 301,600 | 418,700 | 18.3 | 7.7 | 10.6 | 2.43 | 12.8 | 75.3 | 71.6 | 79.1 |
| 2010–2014 | 756,800 | 321,800 | 435,000 | 18.2 | 7.7 | 10.5 | 2.36 | 11.2 | 76.2 | 72.5 | 79.8 |
| 2015–2019 | 702,700 | 341,300 | 361,400 | 16.0 | 7.7 | 8.3 | 2.05 | 9.3 | 77.1 | 73.6 | 80.6 |
| 2020–2024 | 488,000 | 383,000 | 105,000 | 10.6 | 8.3 | 2.3 | 1.40 | 8.1 | 78.6 | 75.5 | 81.8 |
| 2025–2029 | 9.4 | 7.6 | 1.8 | 1.20 | |||||||
| * CBR = crude birth rate (per 1000); CDR = crude death rate (per 1000); NC = natural change (per 1000); IMR = infant mortality rate per 1000 births; TFR = total fertility rate (number of children per woman) |

Argentina's population continues to grow but at a slower rate because of its steadily declining birth rate. Argentina's fertility decline began earlier than in the rest of Latin America, occurring most rapidly between the early 20th century and the 1930s and then becoming more gradual.
Life expectancy has been improving, most notably among the young and the poor.
Demographic statistics according to the World Population Review.
- One birth every 1 minute
- One death every 1.4 minutes
- One net migrant every 111 minutes
- Net gain of one person every 3 minutes
Ethnic groups
- Undeclared (mainly White, Mixed and East Asian) (96.5%)
- Native (2.83%)
- Black (0.66%)
In colonial times, the ethnic composition of Argentina was the result of the interaction of the pre-Columbian indigenous population with a colonizing population of Spanish origin and with sub-Saharan African slaves. Before the middle 19th century, the ethnic make up of Argentina was very similar to that of other countries of Latin America. Between 1857 and 1950 Argentina was the country with the second biggest immigration wave in the world, at 6.6million, second only to the United States in the numbers of immigrants received (27million) and ahead of other areas of new settlement like Canada, Brazil and Australia. However, mass European immigration did not have the same impact in the whole country. According to the 1914 national census, 30% of Argentina's population was foreign-born, including 50% of the people in the city of Buenos Aires, but foreigners were only 2% in the provinces of Catamarca and La Rioja (North West region). Strikingly, at those times, the national population doubled every two decades. This belief is endured in the popular saying "los argentinos descienden de los barcos" ('Argentines descend from the ships'). Therefore, most Argentines are descended from the 19th- and 20th-century immigrants of the great European immigration wave to Argentina (1850–1955), with a great majority of these immigrants coming from diverse European countries, particularly Italy and Spain.
- Caucasian Contribution (77.8%)
- Amerindian Contribution (18.0%)
- Sub-Saharan Contribution (4.20%)
- Caucasian Contribution (67.3%)
- Amerindian Contribution (27.7%)
- Sub-Saharan Contribution (3.60%)
- East Asian Contribution (1.40%)
White Argentines

There are no official census data or statistically significant studies on the precise number or percentage of white Argentinians today, but it is known that they are by far the largest group.
However, several ethnographic estimates have attempted to address the issue. According to an ethnic estimate by the UAEM for all Latin American countries, the white population of Argentina was 85% in 2005. Another estimate published in the Encyclopædia Britannica gives 86.4% in the year 2000. A recent estimate by the Joshua Project, updated to 2025, estimates 36,082,000 white Argentinians in a total population of 45,473,000, which is equivalent to 79.4% of the Argentinian population. Adjusted to the 46,735,004 inhabitants estimated by RENAPER, there would be a total of 37,109,200 white people in Argentina.
Indigenous peoples

According to the data of INDEC's Complementary Survey of Indigenous Peoples (ECPI) 2004–2005, 600,000 officially recognized indigenous people (about 1.4% of the total population) reside in Argentina. The most numerous of these communities are the Mapuches, who live mostly in the south, the Kollas and Wichís, from the northwest, and the Guaranis and Qom, who live mostly in the northeast. In the census of 2010, 955,032 people self recognized as indigenous or descendants of indigenous peoples, thus representing 2.4% of the national population. This is notwithstanding that more than half of the population has at least one indigenous ancestor, although in most cases family memory lost that origin.[citation needed]
| Ethnic group | Survey 2004–2005 | |
|---|---|---|
| Number | % | |
| Aonikenk | 10,590 | 1.8% |
| Atacama | 3,044 | 0.5% |
| Avá-Guaraní | 21,807 | 3.6% |
| Aymara | 4,104 | 0.7% |
| Chané | 4,376 | 0.7% |
| Charrúa | 4,511 | 0.7% |
| Chorote | 2,613 | 0.4% |
| Chulupí | 553 | 0.1% |
| Comechingón | 10,863 | 1.8% |
| Diaguita/diaguita calchaquí | 31,753 | 5.3% |
| Guaraní | 22,059 | 3.7% |
| Het | 736 | 0.1% |
| Huarpe | 14,633 | 2.4% |
| Kolla | 70,505 | 11.7% |
| Lule | 854 | 0.1% |
| Mapuche | 113,680 | 18.8% |
| Mbyá | 8,223 | 1.4% |
| Mocoví | 15,837 | 2.6% |
| Omaguaca | 1,553 | 0.3% |
| Pilagá | 4,465 | 0.7% |
| Puelche | 1,585 | 0.3% |
| Qom | 69,452 | 11.5% |
| Quechua | 6,739 | 1.1% |
| Rankulche | 10,149 | 1.7% |
| Sanavirón | 563 | 0.1% |
| Selkʼnam | 696 | 0.1% |
| Tapiete | 524 | 0.1% |
| Tonocoté | 4,779 | 0.8% |
| Wichí | 40,036 | 6.6% |
| Others | 3,864 | 0.6% |
| Not specified | 102,247 | 16.0% |
Black Argentines
Since 2013, November 8 has been celebrated as the National Day of Afro-Argentines and African Culture. The date was chosen to commemorate the recorded date for the death of María Remedios del Valle, a rabona and guerrilla fighter, who served with the Army of the North in the war of Independence.
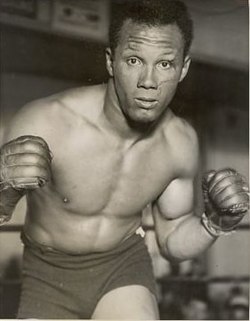
The black population in Argentina declined since the middle 19th century from 15% of the total population in 1857 (Blacks and Mulatto people), to less than 0.5% at present (mainly mulattoes and immigrants from Cape Verde).
Afro-Argentines were up to a third of the population during colonial times; most were slaves brought from Africa to work for the criollos. The 1813 Assembly abolished slavery and led to the Freedom of Wombs Law of 1813, which automatically freed slaves' children at birth. Many Afro-Argentines contributed to the independence of Argentina such as María Remedios del Valle who is known as La Madre de la Patria ('mother of the fatherland') and Sgt. Juan Bautista Cabral. Also there is a debate among the historians as to whether or not Bernardino Rivadavia, the first president of the United Provinces of the Río de la Plata (Present Argentina) had African ancestors.
Immigration to Argentina
European settlement

As with other areas of new settlement such as Canada, Australia, the United States, Brazil, and New Zealand, Argentina is considered a country of immigrants. By 1914, Argentina was only second to the United States in the number of immigrants received, ahead of Canada and Australia.
In the last national census, based on self-identification, 952,032 Argentines (2.4% of the population) declared to be Amerindians. Most of the 6.2million European immigrants arriving between 1850 and 1950, regardless of origin, settled in several regions of the country. Due to this large-scale European immigration, Argentina's population more than doubled.


The majority of these European immigrants came from Spain and Italy. Thousands of immigrants also came from France, Germany, England, Portugal, Brazil, Switzerland, Wales, Scotland, Poland, Albania, Yugoslavia, Czechoslovakia, the Austro-Hungarian Empire, the Ottoman Empire, Russia, Ukraine, Denmark, Sweden, Finland, Norway, Belgium, Luxembourg, the Netherlands, Romania, Bulgaria, Armenia, Greece, Lithuania, Estonia, and Latvia.
Italian population in Argentina arrived mainly from the northern Italian regions varying between Piedmont, Veneto and Lombardy, later from Campania and Calabria; Spanish immigrants were mainly Galicians and Basques. Thousands of immigrants also came from France (notably Béarn and the Northern Basque Country), Germany, Switzerland, Denmark, Sweden, Norway, Greece, Portugal, Finland, Russia and the United Kingdom. The Welsh settlement in Patagonia, known as Y Wladfa, began in 1865; mainly along the coast of Chubut Province. In addition to the main colony in Chubut, a smaller colony was set up in Santa Fe and another group settled at Coronel Suárez, southern Buenos Aires Province. Of the 50,000 Patagonians of Welsh descent, about 5,000 are Welsh speakers. The community is centered on the cities of Gaiman, Trelew and Trevelin.
Recent immigrants

According to the INDEC 1,531,940 of the Argentine resident population in 2001 were born outside Argentina, representing 4.22% of the total Argentine resident population. In 2010, 1,805,957 of the Argentine resident population were born outside Argentina, representing 4.50% of the total Argentine resident population. As of July 2023, more than 18,500 Russians have come to Argentina after the Russian invasion of Ukraine in 2022.
Illegal immigration has been a recent factor in Argentine demographics. Most illegal immigrants come from Bolivia and Paraguay, countries which border Argentina to the north. Smaller numbers arrive from Peru and Ecuador. The Argentine government estimates that 750,000 inhabitants lack official documents and has launched a program called Patria Grande ("Greater Homeland") to encourage illegal immigrants to regularize their status; so far over 670,000 applications have been processed under the program.
| Rank (2022) | Country of birth | Census dates | |||
|---|---|---|---|---|---|
| 2022 | 2010 | 2001 | 1991 | ||
| 1 | Paraguay | 522,598 | 550,713 | 325,046 | 254,115 |
| 2 | Bolivia | 338,299 | 345,272 | 233,464 | 145,670 |
| 3 | Venezuela | 161,495 | 6,379 | 2,774 | 1,934 |
| 4 | Peru | 156,251 | 157,514 | 88,260 | 15,939 |
| 5 | Chile | 149,082 | 191,147 | 212,429 | 247,987 |
| 6 | Uruguay | 95,384 | 116,592 | 117,564 | 135,406 |
| 7 | Italy | 68,169 | 147,499 | 216,718 | 356,923 |
| 8 | Brazil | 49,943 | 41,330 | 34,712 | 33,966 |
| 9 | Spain | 48,492 | 94,030 | 134,417 | 244,212 |
| 10 | Colombia | 46,482 | 17,576 | 3,876 | 2,638 |
| 11 | China | 18,629 | 8,929 | 4,184 | 2,297 |
| 12 | United States | 13,896 | N/D | N/D | N/D |
| 13 | Ecuador | 8,879 | N/D | N/D | N/D |
| 14 | Dominican Republic | 7,817 | N/D | N/D | N/D |
| 15 | Mexico | 5,833 | N/D | N/D | N/D |
| 16 | South Korea | 5,337 | 7,321 | 8,290 | 8,371 |
| 17 | Germany | 4,087 | 8,416 | 10,362 | 15,451 |
| 18 | France | 3,960 | 6,995 | 6,578 | 6,309 |
| 19 | Cuba | 3,921 | N/D | N/D | N/D |
| 20 | Ukraine | 3,486 | N/D | N/D | N/D |
| 21 | Portugal | 3,281 | N/D | N/D | N/D |
| 22 | Taiwan | 3,018 | 2,875 | 3,511 | 1,870 |
| 23 | Japan | 2,703 | 4,036 | 4,753 | 5,674 |
| 24 | Russia | 2,169 | N/D | N/D | N/D |
| 25 | Syria | 1,324 | 1,337 | 2,350 | N/D |
| 26 | Lebanon | N/D | 933 | 1,619 | 3,171 |
| Other countries | 235,928 | 121,018 | 127,683 | 150,849 | |
| Total | 1,933,463 | 1,805,957 | 1,531,940 | 1,628,210 |
- Distribution of ethnoracial groups in 2022
- Native Argentines
- Black Argentines
- Population pyramids of ethnoracial groups in 2022
- Native Argentines
- Black Argentines
Languages

The official language of Argentina is Spanish, and it is spoken by practically the entire population in several different accents. [citation needed] The most common variation of Spanish in Argentina is the Rioplatense Spanish (Spanish:castellano rioplatense), and it is so named because it evolved in the central areas around the Río de la Plata basin. Its distinctive feature is widespread voseo, the use of the pronoun vos instead of tú for the second person singular. Additionally, the Argentinian accent sounds identical to Portuguese in the words that begin with 'll' or 'yo', and all the words in Portuguese that begin with 'ch'. For example, the following sentence English: What is your name? Portuguese: como se chama? Spanish: Como se llama? – 'chama' & 'llama' are pronounced as though they were spelled "Shama"in both Argentinian Spanish and Portuguese. Moreover, the sound shift of all of the words in Spanish that begin with "ll" or 'y' but sound like 'sh' i.e., 'llorar' 'llama, 'llegar' & 'yo'. In Portuguese the words that begin with 'ch' always sound like 'sh'. There are many more words like these shown above. The mutual intelligibility between Spanish and Portuguese is already high, but the 'sh' sound increases the intelligibility between both languages even more.
Non-indigenous minority languages

Many Argentines also speak other European languages (Italian, German, Portuguese, French, Welsh, Swedish and Croatian, as examples) due to the vast number of immigrants from Europe that came to Argentina.
English language is a required subject in many schools, and there are also many private English-teaching academies and institutions. Young people have become accustomed to English through movies and the Internet, and knowledge of the language is also required in most jobs, so most middle-class children and teenagers now speak, read and/or understand it with various degrees of proficiency. According to an official cultural consumption survey conducted in 2006, 42.3% of Argentines claim to speak some English (though only 15.4% of those claimed to have a high level of English comprehension).
There are sources of around one million Levantine Arabic speakers in Argentina, as a result of immigration from the Middle East, mostly from Syria and Lebanon.
Standard German is spoken by around 500,000 Argentines of German ancestry, though the number may be as high as 3,800,000 according to some sources. German is the third or fourth most spoken language in Argentina.
There is a prosperous community of Argentine Welsh-speakers of approximately 25,000 in the province of Chubut, in the Patagonia region, who descend from 19th century immigrants.
Religion
- Catholicism (48.9%)
- Evangelicalism (7.00%)
- No religion (39.8%)
- Islam (1.50%)
- Judaism (1.00%)
- Buddhism (0.50%)
- Hinduism (0.10%)
- Others (1.20%)

The Constitution guarantees freedom of religion, but until 1994 the President and Vice President had to be Catholic. The society, culture, and politics of Argentina are deeply imbued with Roman Catholicism.
Estimates for the number of Roman Catholics vary from 70% of the population, to as much as 90%. The CIA Factbook lists 92% of the country is Catholic, but only 20% are practicing regularly or weekly at a church service. The Jewish population is about 300,000 (around 0.75% of the population), the community numbered about 400,000 after World War II, but the appeal of Israel and economic and cultural pressures at home led many to leave; recent instability in Israel has resulted in a modest reversal of the trend since 2003. Muslim Argentines number about 500,000–600,000, or approximately 1.5% of the population; 93% of them are Sunni. Buenos Aires is home to one of the largest mosques in Latin America. A study from 2010 found that approximately 11% of Argentines are non-religious, including those who believe in God, though not religion, agnostics (4%) and atheists (5%). Overall, 24% attended religious services regularly. Protestants were the only group in which a majority regularly attended services.
Gallery
- Population distribution by province
- Built in 1906 to welcome hundreds of newcomers daily, the Hotel de Inmigrantes is now a national museum.
- Spanish Argentines in the parade for May 25 in Trelew, Chubut.
- Italian Argentines during the opening parade of the Immigrant's Festival in Oberá, Misiones.
See also
- Argentines
- National Institute of Statistics and Census of Argentina
- European Argentines
- Racism in Argentina
- List of largest cities in Argentina
- Immigration to Argentina
- Great European immigration
- Languages of Argentina