Strike rate
In-game article clicks load inline without leaving the challenge.
Strike rate refers to two different statistics in the sport of cricket. Batting strike rate is a measure of how quickly a batter achieves the primary goal of batting, namely scoring runs, measured in runs per 100 balls; higher is better. Bowling strike rate is a measure of how quickly a bowler achieves the primary goal of bowling, namely taking wickets (i.e. getting batters out), measured in balls per wicket; lower is better. For bowlers, economy rate is a more frequently discussed statistic.
Both strike rates are relatively new statistics, having only been invented and considered of importance after the introduction of One Day International cricket in the 1970s.[citation needed]
Batting strike rate
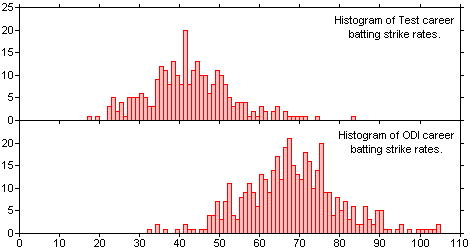
Batting strike rate (s/r) is defined for a batter as the average number of runs scored per 100 balls faced. The higher the strike rate, the more effective a batter is at scoring quickly.
In Test cricket, a batter's strike rate is of secondary importance to ability to score runs without getting out. This means a Test batter's most important statistic is generally considered to be batting average, rather than strike rate.
In limited overs cricket, strike rates are of considerably more importance. Since each team only faces a limited number of balls in an innings, the faster a batter scores, the more runs the team will be able to accumulate. Strike rates of over 150 are becoming common in Twenty20 cricket. Strike rate is probably considered by most as the key factor in a batter in one day cricket. Accordingly, the batters with higher strike rates, especially in Twenty20 matches, are more valued than those with a lesser strike rate. Strike rate is also used to compare a batter’s ability to score runs against differing forms of bowling (eg spin bowling, fast bowling), often giving an indication to the bowling team as to how successfully to limit a batter's ability to score.
Highest career strike rate (T20I)
| Strike rate | Batter | Team | Runs scored | Balls faced | Span |
|---|---|---|---|---|---|
| 198.47 | Musadiq Ahmed † | Germany | 651 | 328 | 2024–2026 |
| 190.46 | Abhishek Sharma † | India | 1,438 | 755 | 2024–2026 |
| 184.23 | Sahil Chauhan † | Estonia | 479 | 260 | 2023–2025 |
| 177.29 | Kayron Stagno † | Gibraltar | 656 | 370 | 2022–2024 |
| 174.58 | Mohammad Ihsan † | Spain | 845 | 484 | 2022–2025 |
| Qualification: 250 balls. Updated: 5 May 2026 |
Highest career strike rate (ODI)
Men's One Day Internationals:
| Rank | Strike rate | Player | Team | Runs | Balls faced | Period |
|---|---|---|---|---|---|---|
| 1 | 130.22 | Andre Russell | West Indies | 1,034 | 794 | 2011–2019 |
| 2 | 126.70 | Glenn Maxwell | Australia | 3,990 | 3,149 | 2012–2025 |
| 3 | 117.06 | Lionel Cann | Bermuda | 590 | 504 | 2006–2009 |
| 4 | 117.05 | Heinrich Klaasen | South Africa | 2,141 | 1,829 | 2018–2025 |
| 5 | 117.00 | Shahid Afridi | Pakistan | 8,064 | 6,892 | 1996–2015 |
| Last updated: 4 March 2025 | ||||||
| Qualification: Faced at least 500 balls. |
Women's One Day Internationals:
| Strike rate | Player | Runs | Balls faced | Period |
|---|---|---|---|---|
| 110.46 | Australia women's national cricket team Ashleigh Gardner | 1,699 | 1,538 | 2017–2026 |
| 102.45 | India women's national cricket team Richa Ghosh | 1,208 | 1,179 | 2021–2026 |
| 101.05 | South Africa women's national cricket team Chloe Tryon | 2,402 | 2,377 | 2011–2026 |
| 100.69 | Australia women's national cricket team Alyssa Healy | 3,777 | 3,751 | 2010–2026 |
| 94.67 | England women's cricket team Nat Sciver-Brunt | 4,354 | 4,599 | 2024–2026 |
| Qualification: 500 balls faced. Last updated: 1 April 2026 |
Bowling strike rate
Bowling strike rate is defined for a bowler as the average number of balls bowled per wicket taken. The lower the strike rate, the more effective a bowler is at taking wickets quickly.
Although introduced as a statistic complementary to the batting strike rate during the ascension of one-day cricket in the 1980s, bowling strike rates are arguably of more importance in Test cricket than One-day Internationals. This is because the primary goal of a bowler in Test cricket is to take wickets, whereas in a one-day match it is often sufficient to bowl economically - giving away as few runs as possible even if this means taking fewer wickets.[original research?]
Best career strike rate (ODI and T20I)
Best career strike rate (Tests)
| Strike rate | Player | Country | Balls | Wickets |
|---|---|---|---|---|
| Retired players (Men) Strike rate Player Country Balls Wickets 34.19 George Lohmann England 3830 112 37.73 J. J. Ferris Australia / England 2302 61 38.75 Shane Bond New Zealand 3372 87 41.65 Sydney Barnes England 7873 189 42.38 Dale Steyn South Africa 18608 439 Qualification: 2,000 balls Last updated: 27 July 2023 | Retired players (Women) Strike rate Player Country Balls Wickets 38.72 Julia Greenwood England 1,123 29 42.42 Betty Wilson Australia 2,885 68 48.49 Mary Duggan England 3,734 77 50.40 Patricia Whittaker West Indies 1,260 25 51.19 Katherine Sciver-Brunt England 2,611 51 Qualification: 1,000 balls Last updated: 27 July 2023 | |||
| 34.19 | George Lohmann | England | 3830 | 112 |
| 37.73 | J. J. Ferris | Australia / England | 2302 | 61 |
| 38.75 | Shane Bond | New Zealand | 3372 | 87 |
| 41.65 | Sydney Barnes | England | 7873 | 189 |
| 42.38 | Dale Steyn | South Africa | 18608 | 439 |
| Qualification: 2,000 balls Last updated: 27 July 2023 | ||||
| Strike rate | Player | Country | Balls | Wickets |
| 38.72 | Julia Greenwood | England | 1,123 | 29 |
| 42.42 | Betty Wilson | Australia | 2,885 | 68 |
| 48.49 | Mary Duggan | England | 3,734 | 77 |
| 50.40 | Patricia Whittaker | West Indies | 1,260 | 25 |
| 51.19 | Katherine Sciver-Brunt | England | 2,611 | 51 |
| Qualification: 1,000 balls Last updated: 27 July 2023 |
| Strike rate | Player | Country | Balls | Wickets |
|---|---|---|---|---|
| Active players (Men) Strike rate Player Country Balls Wickets 38.06 Kuldeep Yadav India 2,893 76 38.29 Marco Jansen South Africa 3,408 89 38.84 Duanne Olivier South Africa 2,292 59 38.91 Scott Boland Australia 3,191 82 39.10 Gus Atkinson England 2,698 69 Qualification: 2,000 balls | Active players (Women) Strike rate Player Country Balls Wickets 46.50 Ashleigh Gardner Australia 1,302 28 52.84 Ellyse Perry Australia 2,061 39 58.56 Kate Cross England 1,464 25 62.72 Sophie Ecclestone England 2,509 40 Qualification: 1000 balls Last updated: 31 December 2025 | |||
| 38.06 | Kuldeep Yadav | India | 2,893 | 76 |
| 38.29 | Marco Jansen | South Africa | 3,408 | 89 |
| 38.84 | Duanne Olivier | South Africa | 2,292 | 59 |
| 38.91 | Scott Boland | Australia | 3,191 | 82 |
| 39.10 | Gus Atkinson | England | 2,698 | 69 |
| Qualification: 2,000 balls | ||||
| Strike rate | Player | Country | Balls | Wickets |
| 46.50 | Ashleigh Gardner | Australia | 1,302 | 28 |
| 52.84 | Ellyse Perry | Australia | 2,061 | 39 |
| 58.56 | Kate Cross | England | 1,464 | 25 |
| 62.72 | Sophie Ecclestone | England | 2,509 | 40 |
| Qualification: 1000 balls Last updated: 31 December 2025 |