Demographics of India
In-game article clicks load inline without leaving the challenge.
India is the most populous country in the world, comprising approximately one-sixth of the world population. According to the United Nations' World Population Dashboard, India's population reached slightly over 1.428 billion in April 2023, surpassing that of China.
India remains a relatively young country, though it is undergoing a gradual demographic transition. As of 2024, the median age is approximately 29.8 years, compared to 40.2 in China. The United Nations Population Fund (UNFPA) estimates that 68% of the population is between 15 and 64 years old, creating a potential "demographic dividend" where a large working-age population can drive economic growth. However, the number of children is declining; the under-5 population peaked in 2007 and the under-15 cohort peaked in 2011.
Between 1975 and 2010, the population doubled to 1.2 billion. While the population continues to grow, the rate has slowed significantly from 2.3% annually (1972–1983) to roughly 0.89% in 2023. Current projections suggest the population will reach 1.7 billion by 2050.
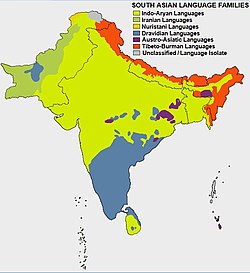
India is highly diverse, hosting thousands of ethnic groups and four major language families: Indo-European, Dravidian, Austroasiatic, and Tibeto-Burman. The country also includes linguistic isolates such as Nihali and Burushaski, and distinct minority communities including Anglo-Indians and Siddi.
The human sex ratio has shown an upward trend after decades of decline, reaching 943 females per 1,000 males in 2011 and estimated at 1,060 males per 1,000 females (approx. 944 females/1000 males) in 2023.
History

Prehistory to early 19th century
The following table lists estimates for the population of India (including what are now Pakistan and Bangladesh) from prehistory up until 1820. It includes estimates and growth rates according to five economic historians, along with interpolated estimates and overall aggregate averages derived from their estimates.
| Year | Maddison (2001) | Clark (1967) | Biraben (1979) | Durand (1974) | McEvedy (1978) | Aggregate average | Period | Average % growth / century | ||||||
|---|---|---|---|---|---|---|---|---|---|---|---|---|---|---|
| Population | % growth / century | Population | % growth / century | Population | % growth / century | Population | % growth / century | Population | % growth / century | Population | % growth / century | |||
| 10,000 BC | —N/a | —N/a | —N/a | —N/a | —N/a | —N/a | —N/a | —N/a | 100,000 | —N/a | 100,000 | —N/a | Stone Age | 3.9 |
| 4000 BC | —N/a | —N/a | —N/a | —N/a | —N/a | —N/a | —N/a | —N/a | 1,000,000 | 3.9 | 1,000,000 | 3.9 | ||
| 2000 BC | —N/a | —N/a | —N/a | —N/a | —N/a | —N/a | —N/a | —N/a | 6,000,000 | 9.4 | 6,000,000 | 9.4 | Bronze Age | 9.4 |
| 500 BC | —N/a | —N/a | —N/a | —N/a | —N/a | —N/a | —N/a | —N/a | 25,000,000 | 10 | 25,000,000 | 10 | Iron Age | 10.2 |
| 400 BC | —N/a | —N/a | —N/a | —N/a | 30,000,000 | —N/a | —N/a | —N/a | 26,600,000 | 6.3 | 28,300,000 | 13.2 | ||
| 200 BC | —N/a | —N/a | —N/a | —N/a | 55,000,000 | 35.4 | —N/a | —N/a | 30,000,000 | 6.3 | 42,500,000 | 22.5 | Maurya era | 22.5 |
| 1 AD | 75,000,000 | —N/a | 70,000,000 | —N/a | 46,000,000 | –9.3 | 75,000,000 | —N/a | 34,000,000 | 6.5 | 60,000,000 | 18.8 | Classical era | 5.3 |
| 200 | 75,000,000 | 0 | 72,500,000 | 1.7 | 45,000,000 | –1.1 | 75,000,000 | 0 | 39,000,000 | 7.1 | 61,300,000 | 1.1 | ||
| 400 | 75,000,000 | 0 | 75,000,000 | 1.7 | 32,000,000 | –18.6 | 75,000,000 | 0 | 45,000,000 | 7.4 | 60,400,000 | –0.7 | ||
| 500 | 75,000,000 | 0 | 75,000,000 | 0 | 33,000,000 | 3.1 | 75,000,000 | 0 | 48,000,000 | 6.5 | 61,200,000 | 1.3 | ||
| 600 | 75,000,000 | 0 | 75,000,000 | 0 | 37,000,000 | 12.1 | 75,000,000 | 0 | 51,000,000 | 6.5 | 62,600,000 | 2.3 | Early medieval era | 1.9 |
| 700 | 75,000,000 | 0 | 75,000,000 | 0 | 50,000,000 | 35.1 | 75,000,000 | 0 | 56,500,000 | 10.3 | 66,300,000 | 5.9 | ||
| 800 | 75,000,000 | 0 | 75,000,000 | 0 | 43,000,000 | –16.3 | 75,000,000 | 0 | 62,000,000 | 10.3 | 66,000,000 | –0.5 | ||
| 900 | 75,000,000 | 0 | 72,500,000 | –3.5 | 38,000,000 | –13.2 | 75,000,000 | 0 | 69,500,000 | 11.4 | 66,000,000 | 0 | ||
| 1000 | 75,000,000 | 0 | 70,000,000 | –3.5 | 40,000,000 | 5.3 | 75,000,000 | 0 | 77,000,000 | 11.4 | 67,400,000 | 2.1 | ||
| 1100 | 81,000,000 | 8 | 72,500,000 | 3.5 | 51,000,000 | 27.5 | 81,300,000 | 8.4 | 80,000,000 | 3.9 | 73,200,000 | 8.6 | Late medieval era | 8.1 |
| 1200 | 87,500,000 | 8 | 75,000,000 | 3.5 | 65,100,000 | 27.5 | 88,200,000 | 8.4 | 83,000,000 | 3.8 | 79,800,000 | 9 | ||
| 1300 | 94,500,000 | 8 | 75,000,000 | 0 | 83,000,000 | 27.5 | 95,700,000 | 8.4 | 88,000,000 | 6 | 87,200,000 | 9.3 | ||
| 1400 | 102,000,000 | 8 | 77,000,000 | 3.3 | 88,800,000 | 7 | 103,700,000 | 8.4 | 94,000,000 | 6.8 | 92,900,000 | 7 | ||
| 1500 | 110,000,000 | 8 | 79,000,000 | 3.3 | 95,000,000 | 7 | 112,500,000 | 8.4 | 100,000,000 | 6.4 | 99,300,000 | 7 | ||
| 1600 | 135,000,000 | 22.8 | 100,000,000 | 26.6 | 145,000,000 | 52.6 | 135,800,000 | 20.7 | 130,000,000 | 30 | 129,200,000 | 30.1 | Mughal era | 31.9 |
| 1650 | 150,000,000 | 22.2 | 150,000,000 | 125 | 160,000,000 | 20.7 | 149,100,000 | 20.7 | 145,000,000 | 24.4 | 150,800,000 | 36.2 | ||
| 1700 | 165,000,000 | 22.2 | 200,000,000 | 77.8 | 175,000,000 | 20.7 | 163,900,000 | 20.7 | 160,000,000 | 21.8 | 172,800,000 | 31.3 | ||
| 1750 | 182,100,000 | 21.8 | 200,000,000 | 0 | 182,700,000 | 9 | 180,000,000 | 20.7 | 170,000,000 | 12.9 | 183,000,000 | 12.1 | Colonial era | 12.2 |
| 1800 | 200,900,000 | 21.8 | 190,000,000 | –10.8 | 190,700,000 | 9 | —N/a | —N/a | 185,000,000 | 18.4 | 190,400,000 | 8 | ||
| 1820 | 209,000,000 | 21.8 | 190,000,000 | 0 | 194,000,000 | 9 | —N/a | —N/a | 200,000,000 | 47.7 | 198,300,000 | 22 |
Population of India over time
India's population has changed significantly due to migrations, technological advancements, and societal developments. Below is a table of historical population estimates:
Estimated Population of India (10,000 BC – 2021)
| Era | Year | Estimated Population | Growth Rate (%) |
|---|---|---|---|
| Classical India | 100 AD | 52,748,932 | +2.8% |
| 200 AD | 54,902,817 | +4.1% | |
| 300 AD | 57,654,213 | +5.0% | |
| 400 AD | 60,834,921 | +5.5% | |
| 500 AD | 64,291,782 | +5.7% | |
| Early Medieval India | 600 AD | 68,102,304 | +5.9% |
| 700 AD | 71,837,610 | +5.5% | |
| 800 AD | 75,983,210 | +5.8% | |
| 900 AD | 81,274,936 | +7.0% | |
| 1000 AD | 86,732,843 | +6.7% | |
| Delhi Sultanate | 1100 AD | 91,403,287 | +5.4% |
| 1200 AD | 96,289,634 | +5.4% | |
| 1300 AD | 101,984,726 | +5.9% | |
| 1400 AD | 111,209,832 | +9.1% | |
| Mughal Empire | 1500 AD | 121,847,294 | +9.6% |
| 1600 AD | 136,204,781 | +11.8% | |
| 1700 AD | 161,874,263 | +18.9% | |
| 1800 AD | 186,432,976 | +15.2% | |
| Colonial Period | 1810 | 190,000,000 | +2.1% |
| 1820 | 195,000,000 | +2.6% | |
| 1830 | 200,000,000 | +2.6% | |
| 1840 | 205,000,000 | +2.5% | |
| 1850 | 210,000,000 | +2.4% | |
| British Raj | 1860 | 215,000,000 | +2.4% |
| 1870 | 220,000,000 | +2.3% | |
| 1881 | 253,891,821 | +15.4% | |
| 1891 | 287,223,431 | +13.1% | |
| 1901 | 317,318,032 | +10.5% | |
| 1911 | 317,369,222 | +0.02% | |
| 1921 | 318,866,673 | +0.46% | |
| 1931 | 337,515,000 | +5.8% | |
| 1941 | 389,000,000 | +15.3% | |
| Post-independence India | 1951 | 361,088,000 | -7.18% |
| 1961 | 439,235,000 | +21.7% | |
| 1971 | 548,159,652 | +24.8% | |
| 1981 | 683,329,097 | +24.7% | |
| 1991 | 846,387,888 | +24.0% | |
| 2001 | 1,028,610,328 | +21.5% | |
| 2011 | 1,210,854,977 | +17.9% | |
| 2021 | 1,390,537,387 | +14.9% |
The population grew from the South Asian Stone Age in 10,000 BC to the Maurya Empire in 200 BC at a steadily increasing growth rate, before population growth slowed down in the classical era up to 500 AD, and then became largely stagnant during the early medieval era up to 1000 AD. The population growth rate then increased in the late medieval era (during the Delhi Sultanate) from 1000 to 1500.
Under the Mughal Empire, India experienced a high economic and demographic upsurge, due to Mughal agrarian reforms that intensified agricultural production. 15% of the population lived in urban centres, higher than the percentage of the population in 19th-century British India and contemporary Europe up until the 19th century. These estimates by Abraham Eraly and Paolo Malanima have been criticised by Tim Dyson, who considers them exaggerations and estimates urbanisation of the Mughal Empire to be less than 9% of the population.
Under the reign of Akbar (reigned 1556–1605) in 1600, the Mughal Empire's urban population was up to 17 million people, larger than the urban population in Europe. By 1700, Mughal India had an urban population of 23 million people, larger than British India's urban population of 22.3 million in 1871. Nizamuddin Ahmad (1551–1621) reported that, under Akbar's reign, Mughal India had 120 large cities and 3,200 townships. A number of cities in India had a population between a quarter-million and half-million people, with larger cities including Agra (in Agra Subah) with up to 800,000 people and Dhaka (in Bengal Subah) with over 1 million people. Mughal India also had a large number of villages, with 455,698 villages by the time of Aurangzeb (reigned 1658–1707).
Late 19th century to early 20th century
The total fertility rate is the number of children born per woman. It is based on fairly good data for the entire years. Sources: Our World in Data and Gapminder Foundation.
| Years | 1880 | 1881 | 1882 | 1883 | 1884 | 1885 | 1886 | 1887 | 1888 | 1889 | 1890 | 1902 |
|---|---|---|---|---|---|---|---|---|---|---|---|---|
| Total Fertility Rate in India | 5.95 | 5.92 | 5.89 | 5.86 | 5.82 | 5.79 | 4.38 | 5.76 | 5.76 | 5.75 | 5.75 | 5.75 |
| Years | 1921 | 1922 | 1923 | 1924 | 1925 | 1926 | 1927 | 1928 | 1929 | 1930 |
|---|---|---|---|---|---|---|---|---|---|---|
| Total Fertility Rate in India | 5.761 | 5.77 | 5.78 | 5.79 | 5.8 | 5.81 | 5.82 | 5.83 | 5.85 | 5.86 |
Life expectancy from 1881 to 1950
| Years | 1881 | 1891 | 1901 | 1905 | 1911 | 1915 | 1921 | 1925 | 1931 | 1935 | 1941 | 1950 |
|---|---|---|---|---|---|---|---|---|---|---|---|---|
| Life expectancy in India | 25.4 | 24.3 | 23.5 | 24.0 | 23.2 | 24.0 | 24.9 | 27.6 | 29.3 | 31.0 | 32.6 | 35.4 |
The population of India under the British Raj (including what are now Pakistan and Bangladesh) according to censuses:
| Census year | Population | Growth (%) |
|---|---|---|
| 1871 | 238,830,958 | —N/a |
| 1881 | 253,896,330 | 6.3 |
| 1891 | 287,223,431 | 13.1 |
| 1901 | 293,550,310 | 2.2 |
| 1911 | 315,156,396 | 7.4 |
| 1921 | 318,942,480 | 1.2 |
| 1931 | 352,837,778 | 10.6 |
| 1941 | 388,997,955 | 10.2 |
Studies of India's population since 1881 have focused on such topics as total population, birth and death rates, geographic distribution, literacy, the rural and urban divide, cities of a million, and the three cities with populations over eight million: Delhi, Greater Mumbai (Bombay), and Kolkata (Calcutta).
Mortality rates fell in the period 1920–45, primarily due to biological immunisation. Suggestions that it was the benefits of colonialism are refuted by academic thinking: "There can be no serious, informed belief... that... late colonial era mortality diminished and population grew rapidly because of improvements in income, living standards, nutrition, environmental standards, sanitation or health policies, nor was there a cultural transformation...".
Languages
- Hindi (26.6%)
- Bengali (7.94%)
- Marathi (6.84%)
- Telugu (6.68%)
- Tamil (5.69%)
- Gujarati (4.55%)
- Urdu (4.19%)
- Bhojpuri (4.18%)
- Kannada (3.59%)
- Malayalam (2.87%)
- Others (26.9%)

| Language | Language Family | Speakers (1971) | Speakers (1981) | Speakers (1991) | Speakers (2001) | Speakers (2011) |
|---|---|---|---|---|---|---|
| Hindi | Indo-Aryan | 202,767,971 | 257,749,009 | 329,505,193 | 422,048,642 | 528,347,193 |
| Bengali | Indo-Aryan | 44,792,312 | 51,298,319 | 69,595,738 | 83,369,769 | 97,237,669 |
| Telugu | Dravidian | 44,756,923 | 50,624,611 | 66,017,615 | 74,002,856 | 81,127,740 |
| Marathi | Indo-Aryan | 41,765,190 | 49,452,922 | 62,481,681 | 71,936,894 | 83,026,680 |
| Tamil | Dravidian | 37,690,106 | – | 53,006,368 | 60,793,814 | 69,026,881 |
| Urdu | Indo-Aryan | 28,620,895 | 34,941,435 | 43,406,932 | 51,536,111 | 50,772,631 |
| Gujarati | Indo-Aryan | 25,865,012 | 33,063,267 | 40,695,370 | 46,091,617 | 55,492,554 |
| Kannada | Dravidian | 21,710,649 | 25,697,146 | 32,753,676 | 37,924,011 | 43,706,512 |
| Malayalam | Dravidian | 21,938,760 | 25,700,705 | 30,377,176 | 33,066,392 | 34,838,819 |
| Odia | Indo-Aryan | 19,863,198 | 23,021,528 | 28,061,313 | 33,017,446 | 37,521,324 |
| Punjabi | Indo-Aryan | 14,108,443 | 19,611,199 | 23,378,744 | 29,102,477 | 33,124,726 |
| Assamese | Indo-Aryan | 8,959,558 | – | 13,079,696 | 13,168,484 | 15,311,351 |
| Maithili | Indo-Aryan | 6,130,026 | 7,522,265 | 7,766,921 | 12,179,122 | 13,583,464 |
| Bhili/Bhilodi# | Indo-Aryan | 3,399,285 | 4,293,314 | 5,572,308 | 9,582,957 | 10,413,637 |
| Santali | Austro-Asiatic | 3,786,899 | 4,332,511 | 5,216,325 | 6,469,600 | 7,368,192 |
| Kashmiri | Indo-Aryan | 2,495,487 | 3,176,975 | – | 5,527,698 | 6,797,587 |
| Nepali | Indo-Aryan | 1,419,835 | 1,360,636 | 2,076,645 | 2,871,749 | 2,926,168 |
| Gondi# | Dravidian | 1,688,284 | 1,913,262 | 2,124,852 | 2,713,790 | 2,984,453 |
| Sindhi | Indo-Aryan | 1,676,875 | 2,044,389 | 2,122,848 | 2,535,485 | 2,772,264 |
| Konkani | Indo-Aryan | 1,508,432 | 1,570,108 | 1,760,607 | 2,489,015 | 2,256,502 |
| Dogri | Indo-Aryan | 1,299,143 | 1,530,616 | – | 2,282,589 | 2,596,767 |
| Khandeshi# | Indo-Aryan | 251,896 | 1,216,789 | 973,709 | 2,075,258 | 1,860,236 |
| Kurukh# | Dravidian | 1,235,665 | 1,333,670 | 1,426,618 | 1,751,489 | 1,988,350 |
| Tulu# | Dravidian | 1,158,419 | 1,417,224 | 1,552,259 | 1,722,768 | 1,846,427 |
| Meiteilon (Manipuri) | Sino-Tibetan | 791,714 | 901,407 | 1,270,216 | 1,466,705 | 1,761,079 |
| Bodo | Sino-Tibetan | 556,576 | – | 1,221,881 | 1,350,478 | 1,482,929 |
| Khasi# | Austro-Asiatic | 479,028 | 628,846 | 912,283 | 1,128,575 | 1,431,344 |
| Mundari# | Austro-Asiatic | 771,253 | 742,739 | 861,378 | 1,061,352 | 1,128,228 |
| Ho# | Austro-Asiatic | 751,389 | 783,301 | 949,216 | 1,042,724 | 1,421,418 |
| Tripuri# | Sino-Tibetan | 372,579 | 502,067 | 694,940 | 854,023 | 1,011,294 |
According to the 2001 census, 41.03% of the Indians spoke Hindi natively, while the rest spoke Assamese, Bengali, Gujarati, Maithili, Kannada, Malayalam, Marathi, Odia, Punjabi, Tamil, Telugu, Urdu and a variety of other languages. There are a total of 122 languages and 234 mother tongues spoken in India. Of these, 22 languages are specified in the Eighth Schedule of Indian Constitution, while 100 are non-specified.
The table below excludes Mao-Maram, Paomata and Purul subdivisions of Senapati District of Manipur state due to cancellation of census results.
Vital statistics

UN estimates
| Year | Mid-year population | Births per year | Deaths per year | Annual change in population | Crude birth rate (per 1000) | Crude death rate (per 1000) | Natural change (per 1000) | Crude migration rate (per 1000) | Total Fertility rate | Infant mortality (per 1000) | Life expectancy |
|---|---|---|---|---|---|---|---|---|---|---|---|
| 1950 | 346,278,817 | 15,287,998 | 7,852,219 | 7,435,779 | 44.15 | 22.68 | 21.6 | 5.73 | 181.2 | 41.7 | |
| 1951 | 353,870,058 | 15,663,440 | 7,973,004 | 7,591,241 | 44.26 | 22.53 | 21.6 | 0.5 | 5.77 | 180.1 | 41.7 |
| 1952 | 361,874,904 | 16,082,888 | 8,048,990 | 8,004,846 | 44.44 | 22.24 | 21.9 | 0.2 | 5.82 | 177.5 | 42.0 |
| 1953 | 370,104,571 | 16,501,176 | 8,169,722 | 8,229,667 | 44.59 | 22.07 | 22.1 | 0 | 5.87 | 175.3 | 42.2 |
| 1954 | 378,687,141 | 16,903,336 | 8,122,090 | 8,582,570 | 44.64 | 21.45 | 22.7 | −0.4 | 5.91 | 172.2 | 43.0 |
| 1955 | 387,700,891 | 17,219,756 | 8,168,768 | 9,013,750 | 44.41 | 21.07 | 22.8 | −0.1 | 5.91 | 169.7 | 43.4 |
| 1956 | 396,988,906 | 17,526,402 | 8,232,471 | 9,288,015 | 44.15 | 20.74 | 22.8 | 0 | 5.91 | 167.3 | 43.8 |
| 1957 | 406,253,895 | 17,825,650 | 8,323,747 | 9,264,989 | 43.88 | 20.49 | 22.8 | 0 | 5.91 | 165.0 | 44.1 |
| 1958 | 415,777,437 | 18,053,426 | 8,374,383 | 9,523,542 | 43.42 | 20.14 | 22.7 | −0.2 | 5.90 | 162.7 | 44.4 |
| 1959 | 425,780,669 | 18,321,022 | 8,395,630 | 10,003,232 | 43.03 | 19.72 | 22.7 | −0.2 | 5.89 | 160.3 | 44.9 |
| 1960 | 435,990,344 | 18,705,012 | 8,467,290 | 10,209,675 | 42.90 | 19.42 | 22.9 | 0.2 | 5.92 | 158.2 | 45.2 |
| 1961 | 446,564,730 | 19,054,934 | 8,586,012 | 10,574,386 | 42.67 | 19.23 | 22.8 | 0.5 | 5.94 | 156.4 | 45.4 |
| 1962 | 457,283,092 | 19,422,986 | 8,679,851 | 10,718,362 | 42.48 | 18.98 | 22.9 | 0.5 | 5.95 | 154.5 | 45.7 |
| 1963 | 468,138,576 | 19,783,962 | 8,767,246 | 10,855,484 | 42.26 | 18.73 | 22.9 | 0.5 | 5.97 | 152.7 | 45.9 |
| 1964 | 479,229,599 | 20,156,988 | 8,871,377 | 11,091,023 | 42.06 | 18.51 | 23.0 | 0.3 | 5.98 | 151.1 | 46.2 |
| 1965 | 490,140,141 | 20,414,206 | 9,488,516 | 10,910,542 | 41.65 | 19.36 | 21.7 | 0.9 | 5.94 | 156.4 | 45.0 |
| 1966 | 500,740,250 | 20,632,990 | 9,543,207 | 10,600,109 | 41.20 | 19.06 | 21.6 | 0.2 | 5.88 | 154.7 | 45.3 |
| 1967 | 511,606,375 | 20,889,458 | 9,609,691 | 10,866,125 | 40.83 | 18.78 | 21.5 | 0 | 5.83 | 153.1 | 45.7 |
| 1968 | 522,716,894 | 21,162,298 | 9,155,303 | 11,110,519 | 40.48 | 17.52 | 22.4 | −0.5 | 5.76 | 145.0 | 47.5 |
| 1969 | 533,880,544 | 21,386,208 | 9,218,624 | 11,163,650 | 40.06 | 17.27 | 22.3 | 0 | 5.68 | 143.3 | 47.9 |
| 1970 | 545,864,268 | 21,705,420 | 9,287,483 | 11,983,724 | 39.76 | 17.01 | 22.3 | −0.1 | 5.62 | 141.7 | 48.2 |
| 1971 | 558,096,383 | 22,169,874 | 9,382,778 | 12,232,115 | 39.72 | 16.81 | 22.5 | −0.1 | 5.57 | 139.9 | 48.6 |
| 1972 | 570,482,142 | 22,509,830 | 9,468,026 | 12,385,759 | 39.46 | 16.60 | 22.5 | 0 | 5.48 | 138.5 | 49.0 |
| 1973 | 583,465,595 | 22,929,810 | 9,517,150 | 12,983,453 | 39.30 | 16.31 | 22.7 | 0.1 | 5.40 | 136.3 | 49.5 |
| 1974 | 597,041,392 | 23,284,796 | 9,489,001 | 13,575,797 | 39.00 | 15.89 | 22.8 | 0 | 5.33 | 133.3 | 50.2 |
| 1975 | 611,309,532 | 23,451,070 | 9,492,655 | 14,268,140 | 38.36 | 15.53 | 22.6 | 0 | 5.20 | 130.7 | 50.8 |
| 1976 | 625,861,887 | 23,935,742 | 9,499,656 | 14,552,355 | 38.24 | 15.18 | 22.7 | −0.4 | 5.13 | 127.9 | 51.4 |
| 1977 | 640,801,105 | 24,070,484 | 9,494,741 | 14,939,218 | 37.56 | 14.82 | 22.2 | 0.1 | 5.01 | 124.9 | 51.9 |
| 1978 | 655,728,226 | 24,359,834 | 9,461,503 | 14,927,121 | 37.15 | 14.43 | 22.1 | 0.3 | 4.89 | 121.7 | 52.5 |
| 1979 | 671,155,745 | 24,833,594 | 9,440,528 | 15,427,519 | 37.00 | 14.07 | 22.3 | 0.2 | 4.81 | 118.4 | 53.1 |
| 1980 | 687,354,031 | 25,471,068 | 9,452,567 | 16,198,286 | 37.06 | 13.75 | 22.5 | 0.4 | 4.78 | 115.2 | 53.6 |
| 1981 | 703,696,255 | 25,868,440 | 9,446,658 | 16,342,224 | 36.76 | 13.42 | 22.7 | 0.3 | 4.70 | 112.1 | 54.2 |
| 1982 | 720,313,474 | 26,221,360 | 9,431,256 | 16,617,219 | 36.40 | 13.09 | 22.6 | 0.3 | 4.62 | 109.3 | 54.7 |
| 1983 | 737,372,685 | 26,637,448 | 9,418,131 | 17,059,211 | 36.13 | 12.77 | 22.6 | 0.2 | 4.57 | 106.7 | 55.3 |
| 1984 | 754,875,451 | 27,113,114 | 9,414,277 | 17,502,766 | 35.92 | 12.47 | 22.7 | 0.2 | 4.52 | 104.2 | 55.8 |
| 1985 | 772,647,801 | 27,366,950 | 9,398,793 | 17,772,350 | 35.42 | 12.16 | 22.5 | 0.2 | 4.43 | 101.8 | 56.3 |
| 1986 | 790,689,978 | 27,848,424 | 9,392,670 | 18,042,177 | 35.22 | 11.88 | 22.7 | −0.1 | 4.40 | 99.4 | 56.8 |
| 1987 | 808,931,261 | 27,860,878 | 9,365,358 | 18,241,283 | 34.44 | 11.58 | 22.2 | 0.2 | 4.31 | 97.0 | 57.3 |
| 1988 | 827,342,997 | 28,040,342 | 9,337,583 | 18,411,736 | 33.89 | 11.29 | 21.9 | 0.2 | 4.22 | 94.6 | 57.8 |
| 1989 | 846,039,530 | 28,154,986 | 9,306,083 | 18,696,533 | 33.28 | 11.00 | 21.6 | 0.3 | 4.13 | 92.2 | 58.2 |
| 1990 | 864,972,219 | 28,171,520 | 9,277,651 | 18,932,689 | 32.57 | 10.73 | 21.1 | 0.5 | 4.05 | 89.8 | 58.7 |
| 1991 | 883,927,607 | 28,305,720 | 9,256,425 | 18,955,388 | 32.02 | 10.47 | 21.0 | 0.2 | 3.96 | 87.6 | 59.1 |
| 1992 | 902,957,072 | 28,365,204 | 9,232,809 | 19,029,465 | 31.41 | 10.22 | 20.7 | 0.3 | 3.88 | 85.5 | 59.5 |
| 1993 | 922,118,380 | 28,374,418 | 9,221,708 | 19,161,308 | 30.77 | 10.00 | 20.3 | 0.4 | 3.80 | 83.5 | 59.8 |
| 1994 | 941,163,775 | 28,512,692 | 9,201,756 | 19,045,395 | 30.30 | 9.78 | 20.0 | 0.4 | 3.72 | 81.4 | 60.2 |
| 1995 | 960,301,048 | 28,588,052 | 9,191,892 | 19,137,273 | 29.77 | 9.57 | 19.7 | 0.4 | 3.65 | 79.3 | 60.6 |
| 1996 | 979,678,464 | 28,623,284 | 9,180,936 | 19,377,416 | 29.22 | 9.37 | 19.4 | 0.3 | 3.58 | 77.1 | 61.0 |
| 1997 | 999,133,765 | 28,659,994 | 9,166,224 | 19,455,301 | 28.68 | 9.17 | 19.0 | 0.4 | 3.51 | 74.8 | 61.4 |
| 1998 | 1,018,665,073 | 28,724,934 | 9,155,898 | 19,531,308 | 28.20 | 8.99 | 18.7 | 0.4 | 3.45 | 72.5 | 61.8 |
| 1999 | 1,038,225,821 | 28,790,310 | 9,141,493 | 19,560,748 | 27.73 | 8.80 | 18.4 | 0.3 | 3.38 | 70.2 | 62.2 |
| 2000 | 1,057,922,728 | 29,111,712 | 9,127,431 | 19,696,907 | 27.52 | 8.63 | 18.3 | 0.1 | 3.35 | 67.8 | 62.7 |
| 2001 | 1,077,898,572 | 29,324,930 | 9,143,228 | 19,975,844 | 27.21 | 8.48 | 18.2 | 0 | 3.30 | 65.4 | 63.1 |
| 2002 | 1,097,600,381 | 29,128,216 | 9,103,548 | 19,701,809 | 26.54 | 8.29 | 17.7 | 0.2 | 3.22 | 63.1 | 63.6 |
| 2003 | 1,116,802,997 | 28,794,442 | 9,074,469 | 19,202,616 | 25.78 | 8.13 | 17.2 | 0.2 | 3.12 | 60.8 | 64.1 |
| 2004 | 1,135,991,510 | 28,537,736 | 9,067,053 | 19,188,513 | 25.12 | 7.98 | 16.7 | 0.2 | 3.05 | 58.6 | 64.5 |
| 2005 | 1,154,676,319 | 28,063,000 | 9,027,961 | 18,684,809 | 24.30 | 7.82 | 16.1 | 0.1 | 2.96 | 56.3 | 65.0 |
| 2006 | 1,172,878,890 | 27,637,610 | 8,995,893 | 18,202,571 | 23.56 | 7.67 | 15.5 | −0.1 | 2.86 | 54.1 | 65.4 |
| 2007 | 1,190,676,028 | 27,304,622 | 8,972,698 | 17,797,138 | 22.93 | 7.54 | 15.1 | −0.3 | 2.78 | 51.9 | 65.8 |
| 2008 | 1,207,930,962 | 27,186,094 | 8,950,894 | 17,254,934 | 22.51 | 7.41 | 14.7 | −0.4 | 2.72 | 49.6 | 66.1 |
| 2009 | 1,225,524,760 | 27,219,670 | 8,934,340 | 17,593,798 | 22.21 | 7.29 | 14.5 | −0.5 | 2.67 | 47.4 | 66.5 |
| 2010 | 1,243,481,564 | 26,900,710 | 8,908,601 | 17,956,804 | 21.63 | 7.16 | 14.1 | −0.2 | 2.60 | 45.2 | 66.9 |
| 2011 | 1,261,224,952 | 26,681,990 | 8,889,393 | 17,743,388 | 21.16 | 7.05 | 13.7 | 0 | 2.54 | 43.0 | 67.4 |
| 2012 | 1,278,674,506 | 26,432,416 | 8,879,964 | 17,449,554 | 20.67 | 6.95 | 13.3 | 0.1 | 2.47 | 40.8 | 67.9 |
| 2013 | 1,295,829,506 | 25,995,998 | 8,888,126 | 17,155,000 | 20.06 | 6.86 | 13.0 | 0.1 | 2.41 | 38.7 | 68.5 |
| 2014 | 1,312,277,184 | 25,050,538 | 8,884,412 | 16,447,678 | 19.09 | 6.77 | 12.3 | 0.2 | 2.31 | 36.7 | 69.1 |
| 2015 | 1,328,024,492 | 25,147,252 | 8,936,426 | 15,747,308 | 18.94 | 6.73 | 12.1 | −0.2 | 2.29 | 34.7 | 69.6 |
| 2016 | 1,343,944,293 | 25,207,146 | 9,004,539 | 15,919,801 | 18.76 | 6.70 | 11.9 | 0 | 2.27 | 32.8 | 70.1 |
| 2017 | 1,359,657,392 | 24,466,744 | 9,072,749 | 15,713,099 | 18.00 | 6.67 | 11.3 | 0.3 | 2.20 | 31.1 | 70.5 |
| 2018 | 1,374,659,068 | 24,620,206 | 9,169,449 | 15,001,676 | 17.91 | 6.67 | 11.0 | −0.1 | 2.18 | 29.4 | 70.7 |
| 2019 | 1,389,030,303 | 24,124,982 | 9,264,486 | 14,371,235 | 17.37 | 6.67 | 10.3 | 0 | 2.11 | 27.9 | 70.9 |
| 2020 | 1,402,617,692 | 23,485,340 | 10,118,286 | 13,587,389 | 16.74 | 7.21 | 9.2 | 0.4 | 2.05 | 26.6 | 70.1 |
| 2021 | 1,414,203,889 | 23,321,854 | 13,093,783 | 11,586,197 | 16.49 | 9.26 | 7.0 | −1.0 | 2.01 | 25.5 | 67.2 |
| 2022 | 1,425,423,212 | 23,286,124 | 9,373,180 | 11,219,323 | 16.34 | 6.58 | 7.2 | −0.4 | 1.99 | 23.8624 | 67.7 |
| 2023 | 1,438,069,597 | 23,219,488 | 9,507,013 | 12,646,385 | 16.15 | 6.61 | 9.5 | −1.4 | 1.98 | 22.6186 | 72.0 |
| 2024 | 1,450,935,791 | 23,186,978 | 9,557,050 | 12,999,094 | 15.98 | 6.59 | 9.39 | -0.43 | 1.96 | ||
| 2025 | 15.8 | 6.6 | 9.1 | 1.94 | |||||||
| 2026 | 15.6 | 6.7 | 8.9 | 1.93 |
Regional growth
| States and UTs | 1901–11 | 1911–21 | 1921–31 | 1931–41 | 1941–51 | 1951–61 | 1961–71 | 1971–81 | 1981–91 | 1991–01 | 2001–11 |
|---|---|---|---|---|---|---|---|---|---|---|---|
| India | +5.75 | -0.31 | +11.00 | +14.22 | +13.31 | +21.51 | +24.80 | +24.66 | +23.87 | +21.54 | +17.70 |
| Jammu and Kashmir | +7.16 | +5.75 | +10.14 | +10.36 | +10.42 | +9.44 | +29.65 | +29.69 | +30.89 | +29.43 | +23.64 |
| Himachal Pradesh | - 1.22 | +1.65 | +5.23 | +11.54 | +5.42 | +17.87 | +23.04 | +23.71 | +20.79 | +17.54 | +12.94 |
| Punjab | -10.78 | +6.26 | +12.02 | +19.82 | -4.58 | +21.56 | +21.70 | +23.89 | +20.81 | +20.10 | +13.89 |
| Chandigarh | -16.07 | -1.65 | +9.10 | +14.11 | +7.47 | +394.13 | +114.59 | +75.55 | +42.16 | +40.28 | +17.19 |
| Uttarakhand | +8.20 | -1.23 | +8.74 | +13.63 | +12.67 | +22.57 | +24.42 | +27.45 | +23.13 | +20.41 | +18.81 |
| Haryana | -9.70 | +1.95 | +7.14 | +15.63 | +7.60 | +33.79 | +32.22 | +28.75 | +27.41 | +28.43 | +19.90 |
| Delhi | +1.98 | +18.03 | +30.26 | +44.27 | +90.00 | +52.44 | +52.93 | +53.00 | +51.45 | +47.02 | +21.21 |
| Rajasthan | +6.70 | -6.29 | +14.14 | +18.01 | +15.20 | +26.20 | +27.83 | +32.97 | +28.44 | +28.41 | +21.31 |
| Uttar Pradesh | -1.36 | -3.16 | +6.56 | +13.57 | +11.78 | +16.38 | +19.54 | +25.39 | +25.61 | +25.85 | +20.23 |
| Bihar | +1.52 | -0.97 | +9.74 | +12.22 | +10.58 | +19.79 | +20.91 | +24.16 | +23.38 | +28.62 | +25.42 |
| Sikkim | +48.98 | -7.05 | +34.37 | +10.67 | +13.34 | +17.76 | +29.38 | +50.77 | +28.47 | +33.06 | +12.89 |
| Arunachal Pradesh | —N/a | —N/a | —N/a | —N/a | —N/a | —N/a | +38.91 | +35.15 | +36.83 | +27.00 | +26.03 |
| Nagaland | +46.76 | +6.55 | +12.62 | +6.04 | +8.60 | +14.07 | +39.88 | +50.05 | +56.08 | +64.53 | -0.58 |
| Manipur | +21.71 | +10.92 | +16.04 | +14.92 | +12.80 | +35.04 | +37.53 | +32.46 | +29.29 | +24.86 | +24.50 |
| Mizoram | +10.64 | +7.90 | +26.42 | +22.81 | +28.42 | +35.61 | +24.93 | +48.55 | +39.70 | +28.82 | +23.48 |
| Tripura | +32.48 | +32.59 | +25.63 | +34.14 | +24.56 | +78.71 | +36.28 | +31.92 | +34.30 | +16.03 | +14.84 |
| Meghalaya | +15.71 | +7.21 | +13.83 | +15.59 | +8.97 | +27.03 | +31.50 | +32.04 | +32.86 | +30.65 | +27.95 |
| Assam | +16.99 | +20.48 | +19.91 | +20.40 | +19.93 | +34.98 | +34.95 | +23.36 | +24.24 | +18.92 | +17.07 |
| West Bengal | +6.25 | -2.91 | +8.14 | +22.93 | +13.22 | +32.80 | +26.87 | +23.17 | +24.73 | +17.77 | +13.84 |
| Jharkhand | +11.19 | +0.31 | +16.86 | +12.13 | +9.35 | +19.69 | +22.58 | +23.79 | +24.03 | +23.36 | +22.42 |
| Odisha | +10.44 | -1.94 | +11.94 | +10.22 | +6.38 | +19.82 | +25.05 | +20.17 | +20.06 | +16.25 | +14.05 |
| Chhattisgarh | +24.15 | +1.41 | +14.51 | +13.04 | +9.42 | +22.77 | +27.12 | +20.39 | +25.73 | +18.27 | +22.61 |
| Madhya Pradesh | +12.38 | -2.40 | +10.21 | +12.06 | +8.38 | +24.73 | +29.28 | +27.16 | +27.24 | +24.26 | +20.35 |
| Gujarat | +7.79 | +3.79 | +12.92 | +19.25 | +18.69 | +26.88 | +29.39 | +27.67 | +21.19 | +22.66 | +19.28 |
| Daman and Diu | +1.45 | -3.26 | +15.98 | +17.52 | +13.55 | -24.56 | +70.85 | +26.07 | +28.62 | +55.73 | +53.76 |
| Dadra and Nagar Haveli | +19.52 | +6.99 | +23.23 | +5.70 | +2.70 | +39.56 | +27.96 | +39.78 | +33.57 | +59.22 | +55.88 |
| Maharashtra | +10.74 | -2.91 | +14.91 | +11.99 | +19.27 | +23.60 | +27.45 | +24.54 | +25.73 | +22.73 | +15.99 |
| Andhra Pradesh | +12.49 | -0.13 | +12.99 | +12.75 | +14.02 | +15.65 | +20.90 | +23.10 | +24.20 | +14.59 | +10.98 |
| Karnataka | +3.60 | -1.09 | +9.38 | +11.09 | +19.36 | +21.57 | +24.22 | +26.75 | +21.12 | +17.51 | +15.60 |
| Goa | +2.36 | -3.55 | +7.62 | +7.05 | +1.21 | +7.77 | +34.77 | +26.74 | +16.08 | +15.21 | +8.23 |
| Lakshadweep | +4.85 | -6.31 | +17.62 | +14.43 | +14.60 | +14.61 | +31.95 | +26.53 | +28.47 | +17.30 | +6.30 |
| Kerala | +11.75 | +9.16 | +21.85 | +16.04 | +22.82 | +24.76 | +26.29 | +19.24 | +14.32 | +9.43 | +4.91 |
| Tamil Nadu | +8.57 | +3.47 | +8.52 | +11.91 | +14.66 | +11.85 | +22.30 | +17.50 | +15.39 | +11.72 | +15.61 |
| Puducherry | +4.39 | -5.06 | +5.93 | +10.20 | +11.31 | +16.34 | +27.81 | +28.15 | +33.64 | +20.62 | +28.08 |
| Andaman and Nicobar Islands | +7.34 | +2.37 | +8.78 | +14.61 | -8.28 | +105.19 | +81.17 | +63.93 | +48.70 | +26.90 | +6.86 |
Census of India: Sample Registration System

| Year | Average population | Live births1 | Deaths1 | Natural change | Crude birth rate (per 1000) | Crude death rate (per 1000) | Natural change (per 1000) | Total fertility rate |
|---|---|---|---|---|---|---|---|---|
| 1981 | 716,493,000 | 24,289,000 | 8,956,000 | 15,333,000 | 33.9 | 12.5 | 21.4 | 4.52 |
| 1982 | 733,152,000 | 24,781,000 | 8,725,000 | 16,056,000 | 33.8 | 11.9 | 21.9 | 4.5 |
| 1983 | 750,034,000 | 25,276,000 | 8,925,000 | 16,351,000 | 33.7 | 11.9 | 21.8 | 4.5 |
| 1984 | 767,147,000 | 26,006,000 | 9,666,000 | 16,340,000 | 33.9 | 12.6 | 21.3 | 4.5 |
| 1985 | 784,491,000 | 25,810,000 | 9,257,000 | 16,553,000 | 32.9 | 11.8 | 21.1 | 4.3 |
| 1986 | 802,052,000 | 26,147,000 | 8,903,000 | 17,244,000 | 32.6 | 11.1 | 21.5 | 4.15 |
| 1987 | 819,800,000 | 26,316,000 | 8,936,000 | 17,380,000 | 32.1 | 10.9 | 21.2 | 4.1 |
| 1988 | 837,700,000 | 26,388,000 | 9,215,000 | 17,173,000 | 31.5 | 11.0 | 20.5 | 4.0 |
| 1989 | 855,707,000 | 26,185,000 | 8,814,000 | 17,371,000 | 30.6 | 10.3 | 20.3 | 3.9 |
| 1990 | 873,785,000 | 26,388,000 | 8,476,000 | 17,912,000 | 30.2 | 9.7 | 20.5 | 3.8 |
| 1991 | 891,910,000 | 26,133,000 | 8,741,000 | 17,392,000 | 29.3 | 9.8 | 19.5 | 3.64 |
| 1992 | 910,065,000 | 26,392,000 | 9,192,000 | 17,200,000 | 29.0 | 10.1 | 18.9 | 3.6 |
| 1993 | 928,226,000 | 26,640,000 | 8,633,000 | 18,007,000 | 0 | 9.3 | 19.4 | 3.5 |
| 1994 | 946,373,000 | 27,161,000 | 8,801,000 | 18,360,000 | 28.7 | 9.3 | 19.4 | 3.5 |
| 1995 | 964,486,000 | 27,295,000 | 8,680,000 | 18,615,000 | 28.3 | 9.0 | 19.3 | 3.5 |
| 1996 | 982,553,000 | 26,824,000 | 8,745,000 | 18,079,000 | 27.3 | 8.9 | 18.4 | 3.40 |
| 1997 | 1,000,558,000 | 27,215,000 | 8,905,000 | 18,310,000 | 27.2 | 8.9 | 18.3 | 3.3 |
| 1998 | 1,018,471,000 | 26,989,000 | 9,166,000 | 17,823,000 | 26.5 | 9.0 | 17.5 | 3.2 |
| 1999 | 1,036,259,000 | 26,943,000 | 9,015,000 | 17,928,000 | 26.0 | 8.7 | 17.3 | 3.2 |
| 2000 | 1,053,898,000 | 27,191,000 | 8,958,000 | 18,233,000 | 25.8 | 8.5 | 17.3 | 3.2 |
| 2001 | 1,071,374,000 | 27,213,000 | 9,000,000 | 18,213,000 | 25.4 | 8.4 | 17.0 | 3.10 |
| 2002 | 1,088,694,000 | 27,217,000 | 8,818,000 | 18,399,000 | 25.0 | 8.1 | 16.9 | 3.0 |
| 2003 | 1,105,886,000 | 27,426,000 | 8,847,000 | 18,579,000 | 24.8 | 8.0 | 16.8 | 3.0 |
| 2004 | 1,122,991,000 | 27,064,000 | 8,422,000 | 18,642,000 | 24.1 | 7.5 | 16.6 | 2.9 |
| 2005 | 1,140,043,000 | 27,133,000 | 8,664,000 | 18,469,000 | 23.8 | 7.6 | 16.2 | 2.9 |
| 2006 | 1,157,039,000 | 27,190,000 | 8,678,000 | 18,512,000 | 23.5 | 7.5 | 16.0 | 2.79 |
| 2007 | 1,134,024,000 | 26,195,954 | 8,391,778 | 17,804,176 | 23.1 | 7.4 | 15.7 | 2.7 |
| 2008 | 1,150,196,000 | 26,224,469 | 8,511,450 | 17,713,019 | 22.8 | 7.4 | 15.4 | 2.6 |
| 2009 | 1,166,228,000 | 26,240,130 | 8,513,464 | 17,726,666 | 22.5 | 7.3 | 15.2 | 2.6 |
| 2010 | 1,182,108,000 | 26,124,587 | 8,511,178 | 17,613,409 | 22.1 | 7.2 | 14.9 | 2.5 |
| 2011 | 1,197,658,000 | 26,108,944 | 8,503,372 | 17,605,572 | 21.8 | 7.1 | 14.7 | 2.44 |
| 2012 | 1,212,827,000 | 26,197,063 | 8,489,789 | 17,707,274 | 21.6 | 7.0 | 14.6 | 2.38 |
| 2013 | 1,227,012,000 | 26,258,057 | 8,589,084 | 17,668,973 | 21.4 | 7.0 | 14.4 | 2.34 |
| 2014 | 1,243,542,000 | 25,904,377 | 8,264,730 | 17,639,647 | 21.0 | 6.7 | 14.3 | 2.32 |
| 2015 | 1,259,108,000 | 26,189,446 | 8,184,202 | 18,005,244 | 20.8 | 6.5 | 14.3 | 2.27 |
| 2016 | 1,273,986,000 | 25,989,314 | 8,153,510 | 17,835,804 | 20.4 | 6.4 | 14.0 | 2.26 |
| 2017 | 1,288,522,000 | 26,028,144 | 8,117,689 | 17,910,455 | 20.2 | 6.3 | 13.9 | 2.18 |
| 2018 | 1,324,609,000 | 26,492,180 | 8,212,576 | 18,279,604 | 20.0 | 6.2 | 13.8 | 2.15 |
| 2019 | 1,338,995,000 | 24,820,886 | 7,641,076 | 17,179,810 | 18.5 | 5.7 | 12.8 | 2.08 |
| 2020 | 1,353,378,000 | 24,222,444 | 8,115,882 | 16,106,562 | 17.4 | 6.0 | 11.5 | 2.03 |
| 2021 | 1,414,203,889 | 27,294,135 | 10,606,529 | 16,687,606 | 19.3 | 7.5 | 11.8 | 2.00 |
| 2022 | 1,425,423,212 | 27,225,583 | 9,692,878 | 17,532,705 | 19.1 | 6.8 | 12.3 | 2.00 |
| 2023 | 1,438,069,596 | 26,460,481 | 9,203,645 | 17,256,836 | 18.4 | 6.4 | 12.0 | 1.9 |
| 1 The numbers of births and deaths were calculated from the birth and death rates and the average population. |
Life expectancy


| Period | Life expectancy at birth | Life expectancy at age 15 | Life expectancy at age 65 | Life expectancy at age 80 |
|---|---|---|---|---|
| 1950 | 41.18 | 60.06 | 75.90 | 84.77 |
| 1955 | 43.74 | 60.96 | 76.14 | 84.86 |
| 1960 | 45.61 | 61.75 | 76.33 | 84.93 |
| 1965 | 45.56 | 61.84 | 76.20 | 84.91 |
| 1970 | 48.59 | 63.40 | 76.55 | 85.30 |
| 1975 | 50.76 | 64.68 | 77.00 | 85.69 |
| 1980 | 53.59 | 66.10 | 77.22 | 85.82 |
| 1985 | 56.32 | 67.35 | 77.30 | 85.81 |
| 1990 | 58.62 | 68.32 | 77.59 | 85.94 |
| 1995 | 60.63 | 69.08 | 78.06 | 86.22 |
| 2000 | 62.75 | 69.92 | 78.56 | 86.44 |
| 2005 | 64.94 | 70.84 | 78.87 | 86.45 |
| 2010 | 67.16 | 71.83 | 79.28 | 86.64 |
| 2015 | 69.33 | 72.88 | 79.91 | 87.14 |
| 2020 | 70.16 | 72.81 | 79.48 | 86.92 |
Demographic and Health Surveys From the Demographic Health Survey:

| Year | Total | Urban | Rural | |||
|---|---|---|---|---|---|---|
| CBR | TFR1 | CBR | TFR1 | CBR | TFR1 | |
| 1992–1993 | 28.7 | 3.39 (2.64) | 24.1 | 2.70 (2.09) | 30.4 | 3.67 (2.86) |
| 1998–1999 | 24.8 | 2.85 (2.13) | 20.9 | 2.27 (1.73) | 26.2 | 3.07 (2.28) |
| 2005–2006 | 23.1 | 2.68 (1.90) | 18.8 | 2.06 (1.60) | 25.0 | 2.98 (2.10) |
| 2015–2016 | 19.0 | 2.18 (1.8) | 15.8 | 1.75 (1.5) | 20.7 | 2.41 (1.9) |
| 2019–2021 | 17.1 | 1.99 (1.6) | 14.0 | 1.63 (1.4) | 18.6 | 2.14 (1.7) |
| CBR = crude birth rate (per 1000); TFR = total fertility rate (number of children per woman). 1Number in parentheses represents the wanted fertility rate. |
| Year | Hindu | Muslim | Christian | Sikh | Buddhist/ Neo-Buddhist | Jain | Other |
|---|---|---|---|---|---|---|---|
| 2019–2021 | 1.94 (1.6) | 2.36 (1.8) | 1.88 (1.7) | 1.61 (1.4) | 1.39 (1.2) | 1.60 (1.5) | 2.15 (1.7) |
| CBR = crude birth rate (per 1000); TFR = total fertility rate (number of children per woman). 1Number in parentheses represents the wanted fertility rate. |
| State (Population 2011) | Total | Urban | Rural | |||
|---|---|---|---|---|---|---|
| CBR | TFR1 | CBR | TFR1 | CBR | TFR1 | |
| Uttar Pradesh (199 812 341) | 22.6 | 2.74 (2.06) | 18.6 | 2.08 (1.62) | 24.0 | 2.99 (2.22) |
| Maharashtra (112 374 333) | 16.6 | 1.87 (1.57) | 15.5 | 1.68 (1.41) | 17.5 | 2.06 (1.73) |
| Bihar (104 099 452) | 27.1 | 3.41 (2.48) | 20.4 | 2.42 (1.83) | 28.0 | 3.56 (2.58) |
| West Bengal (91 276 115) | 16.6 | 1.77 (1.53) | 14.0 | 1.57 (1.38) | 18.0 | 1.85 (1.58) |
| Madhya Pradesh (72 626 809) | 20.2 | 2.32 (1.82) | 17.7 | 1.95 (1.61) | 21.3 | 2.48 (1.91) |
| Tamil Nadu (72 147 030) | 15.5 | 1.70 (1.51) | 13.9 | 1.54 (1.38) | 17.2 | 1.86 (1.63) |
| Rajasthan (68 548 437) | 20.8 | 2.40 (1.81) | 17.5 | 1.94 (1.52) | 22.0 | 2.56 (1.91) |
| Karnataka (61 095 297) | 15.9 | 1.81 (1.42) | 15.2 | 1.65 (1.30) | 16.5 | 1.92 (1.50) |
| Gujarat (60 439 692) | 16.7 | 2.03 (1.54) | 15.3 | 1.82 (1.39) | 17.9 | 2.19 (1.64) |
| Andhra Pradesh (49 386 799) | 16.1 | 1.83 (1.64) | 13.9 | 1.53 (1.39) | 17.0 | 1.96 (1.75) |
| Odisha (41 974 218) | 18.1 | 2.05 (1.69) | 15.6 | 1.73 (1.50) | 18.7 | 2.12 (1.72) |
| Telangana (35 193 978) | 17.1 | 1.79 (1.59) | 17.1 | 1.67 (1.53) | 17.2 | 1.88 (1.64) |
| Kerala (33 406 061) | 11.2 | 1.56 (1.47) | 11.4 | 1.57 (1.47) | 11.0 | 1.55 (1.46) |
| Jharkhand (32 988 134) | 21.7 | 2.55 (2.06) | 16.3 | 1.78 (1.47) | 23.5 | 2.83 (2.27) |
| Assam (31 205 576) | 19.5 | 2.21 (1.78) | 13.2 | 1.45 (1.25) | 20.5 | 2.34 (1.87) |
| Punjab (27 743 338) | 13.8 | 1.62 (1.37) | 13.5 | 1.59 (1.32) | 14.0 | 1.63 (1.39) |
| Chhattisgarh (25 545 198) | 20.7 | 2.23 (1.88) | 17.9 | 1.78 (1.58) | 21.5 | 2.37 (1.97) |
| Haryana (25 351 462) | 18.7 | 2.05 (1.63) | 16.3 | 1.78 (1.44) | 20.2 | 2.22 (1.75) |
| Jammu and Kashmir (12 541 302) | 17.7 | 2.01 (1.67) | 13.9 | 1.58 (1.39) | 19.4 | 2.18 (1.77) |
| Uttarakhand (10 086 292) | 19.0 | 2.07 (1.60) | 17.1 | 1.80 (1.43) | 20.0 | 2.24 (1.71) |
| Himachal Pradesh (6 864 602) | 15.3 | 1.88 (1.55) | 12.0 | 1.43 (1.15) | 15.7 | 1.92 (1.59) |
| Tripura (3 673 917) | 15.3 | 1.69 (1.55) | 12.7 | 1.40 (1.34) | 16.4 | 1.80 (1.62) |
| Meghalaya (2 966 889) | 24.6 | 3.04 (2.79) | 16.1 | 1.67 (1.57) | 26.7 | 3.47 (3.18) |
| Manipur (2 855 794) | 21.2 | 2.61 (2.33) | 17.5 | 2.14 (1.96) | 23.7 | 2.92 (2.57) |
| Nagaland (1 978 502) | 21.4 | 2.74 (2.35) | 16.3 | 1.78 (1.58) | 24.1 | 3.38 (2.86) |
| Goa (1 458 545) | 12.8 | 1.66 (1.37) | 13.4 | 1.72 (1.37) | 11.7 | 1.55 (1.37) |
| Arunachal Pradesh (1 383 727) | 17.9 | 2.12 (1.64) | 17.0 | 1.69 (1.26) | 18.2 | 2.29 (1.79) |
| Mizoram (1 097 206) | 18.7 | 2.26 (2.15) | 16.9 | 1.97 (1.89) | 21.2 | 2.71 (2.54) |
| Sikkim (610 577) | 11.4 | 1.17 (0.88) | 12.1 | 1.11 (0.82) | 11.1 | 1.21 (0.91) |
| CBR = crude birth rate (per 1000); TFR = total fertility rate (number of children per woman). 1Number in parentheses represents the wanted fertility rate. |
| State (Population 2011) | Total | Urban | Rural | |||
|---|---|---|---|---|---|---|
| CBR | TFR1 | CBR | TFR1 | CBR | TFR1 | |
| Uttar Pradesh (199 812 341) | 20.5 | 2.35 (1.77) | 16.7 | 1.88 (1.49) | 21.8 | 2.50 (1.86) |
| Maharashtra (112 374 333) | 13.8 | 1.71 (1.43) | 12.6 | 1.50 (1.27) | 15.0 | 1.89 (1.58) |
| Bihar (104 099 452) | 25.9 | 2.98 (2.25) | 20.4 | 2.35 (1.88) | 27.0 | 3.11 (2.31) |
| West Bengal (91 276 115) | 15.5 | 1.64 (1.42) | 12.4 | 1.39 (1.24) | 17.0 | 1.73 (1.48) |
| Madhya Pradesh (72 626 809) | 17.2 | 1.99 (1.61) | 13.7 | 1.61 (1.34) | 18.5 | 2.12 (1.69) |
| Tamil Nadu (72 147 030) | 13.7 | 1.76 (1.59) | 12.7 | 1.61 (1.50) | 14.6 | 1.89 (1.66) |
| Rajasthan (68 548 437) | 18.7 | 2.01 (1.61) | 15.3 | 1.67 (1.42) | 19.8 | 2.11 (1.65) |
| Karnataka (61 095 297) | 14.2 | 1.67 (1.38) | 13.2 | 1.50 (1.25) | 14.9 | 1.79 (1.46) |
| Gujarat (60 439 692) | 15.0 | 1.86 (1.53) | 13.3 | 1.65 (1.39) | 16.3 | 2.0 (1.60) |
| Andhra Pradesh (49 386 799) | 13.8 | 1.68 (1.55) | 12.5 | 1.47 (1.36) | 14.3 | 1.78 (1.64) |
| Odisha (41 974 218) | 15.9 | 1.82 (1.52) | 13.1 | 1.48 (1.26) | 16.5 | 1.89 (1.57) |
| Telangana (35 193 978) | 15.3 | 1.75 (1.55) | 16.0 | 1.75 (1.57) | 15.3 | 1.74 (1.54) |
| Kerala (33 406 061) | 11.8 | 1.79 (1.68) | 11.9 | 1.82 (1.71) | 11.6 | 1.76 (1.65) |
| Jharkhand (32 988 134) | 20.2 | 2.26 (1.87) | 14.2 | 1.56 (1.32) | 22.0 | 2.48 (2.04) |
| Assam (31 205 576) | 16.8 | 1.87 (1.56) | 13.1 | 1.50 (1.37) | 17.4 | 1.93 (1.59) |
| Punjab (27 743 338) | 13.3 | 1.63 (1.35) | 12.1 | 1.55 (1.29) | 14.0 | 1.68 (1.38) |
| Chhattisgarh (25 545 198) | 16.4 | 1.82 (1.57) | 13.6 | 1.42 (1.28) | 17.2 | 1.94 (1.66) |
| Haryana (25 351 462) | 16.4 | 1.91 (1.54) | 14.1 | 1.65 (1.38) | 17.5 | 2.04 (1.62) |
| Jammu and Kashmir (12 541 302) | 13.1 | 1.41 (1.3) | ||||
| Uttarakhand (10 086 292) | 16.7 | 1.85 (1.46) | 16.8 | 1.84 (1.47) | 16.6 | 1.86 (1.47) |
| Himachal Pradesh (6 864 602) | 12.7 | 1.66 (1.43) | 11.2 | 1.43 (1.36) | 12.9 | 1.69 (1.44) |
| Tripura (3 673 917) | 14.5 | 1.70 (1.49) | 11.0 | 1.39 (1.29) | 15.8 | 1.81 (1.56) |
| Meghalaya (2 966 889) | 24.2 | 2.91 (2.66) | 14.8 | 1.57 (1.43) | 26.5 | 3.31 (3.04) |
| Manipur (2 855 794) | 17.4 | 2.17 (1.98) | 14.7 | 1.84 (1.73) | 19.1 | 2.38 (2.13) |
| Nagaland (1 978 502) | 15.4 | 1.72 (1.57) | 12.5 | 1.21 (1.13) | 16.8 | 2.00 (1.82) |
| Goa (1 458 545) | 10.3 | 1.30 (1.21) | 10.3 | 1.26 (1.19) | 10.3 | 1.36 (1.24) |
| Arunachal Pradesh (1 383 727) | 16.0 | 1.80 (1.49) | 14.8 | 1.44 (1.24) | 16.2 | 1.88 (1.54) |
| Mizoram (1 097 206) | 15.0 | 1.87 (1.78) | 13.9 | 1.63 (1.56) | 16.4 | 2.19 (2.08) |
| Sikkim (610 577) | 10.2 | 1.05 (0.85) | 7.8 | 0.71 (0.54) | 11.7 | 1.32 (1.11) |
| Delhi | 14.8 | 1.62 (1.29) | 14.6 | 1.60 (1.27) | 23.4 | 2.47 (2.06) |
| CBR = crude birth rate (per 1000); TFR = total fertility rate (number of children per woman). 1Number in parentheses represents the wanted fertility rate. |
Regional vital statistics
| State or UT | Birth rate | Death rate | Natural growth rate | Infant mortality rate | ||||||||
|---|---|---|---|---|---|---|---|---|---|---|---|---|
| Total | Rural | Urban | Total | Rural | Urban | Total | Rural | Urban | Total | Rural | Urban | |
| Andaman and Nicobar Islands | 15.6 | 15.5 | 15.8 | 4.3 | 4.8 | 3.3 | 11.3 | 10.7 | 12.6 | 25 | 29 | 18 |
| Andhra Pradesh | 17.9 | 18.3 | 16.7 | 7.6 | 8.6 | 5.4 | 10.2 | 9.7 | 11.3 | 46 | 51 | 33 |
| Arunachal Pradesh | 20.5 | 22.1 | 14.6 | 5.9 | 6.9 | 2.3 | 14.6 | 15.2 | 12.3 | 31 | 34 | 12 |
| Assam | 23.2 | 24.4 | 15.8 | 8.2 | 8.6 | 5.8 | 14.9 | 15.8 | 10.1 | 58 | 60 | 36 |
| Bihar | 28.1 | 28.8 | 22.0 | 6.8 | 7.0 | 5.6 | 21.3 | 21.8 | 16.4 | 48 | 49 | 38 |
| Chandigarh | 15.6 | 21.6 | 15.0 | 3.9 | 3.7 | 3.9 | 11.6 | 17.9 | 11.0 | 22 | 20 | 23 |
| Chhattisgarh | 25.3 | 26.8 | 18.6 | 8.0 | 8.4 | 6.2 | 17.3 | 18.4 | 12.4 | 51 | 52 | 44 |
| Dadra and Nagar Haveli | 26.6 | 26.0 | 28.6 | 4.7 | 5.1 | 3.3 | 21.9 | 20.9 | 25.3 | 38 | 43 | 22 |
| Daman and Diu | 18.8 | 19.1 | 18.3 | 4.9 | 4.9 | 4.8 | 13.9 | 14.2 | 13.6 | 23 | 19 | 29 |
| Delhi | 17.8 | 19.7 | 17.5 | 4.2 | 4.6 | 4.1 | 13.6 | 15.0 | 13.4 | 30 | 37 | 29 |
| Goa | 13.2 | 12.6 | 13.7 | 6.6 | 8.1 | 5.7 | 6.6 | 4.5 | 8.0 | 10 | 10 | 10 |
| Gujarat | 21.8 | 23.3 | 19.4 | 6.7 | 7.5 | 5.5 | 15.1 | 15.8 | 14.0 | 44 | 51 | 30 |
| Haryana | 22.3 | 23.3 | 19.8 | 6.6 | 7.0 | 5.6 | 15.7 | 16.3 | 14.3 | 48 | 51 | 38 |
| Himachal Pradesh | 16.9 | 17.5 | 11.5 | 6.9 | 7.2 | 4.2 | 10.0 | 10.3 | 7.3 | 40 | 41 | 29 |
| Jammu and Kashmir | 18.3 | 19.5 | 13.5 | 5.7 | 5.9 | 4.7 | 12.6 | 13.6 | 8.8 | 43 | 45 | 32 |
| Jharkhand | 25.3 | 26.7 | 19.3 | 7.0 | 7.4 | 5.4 | 18.3 | 19.3 | 13.9 | 42 | 44 | 30 |
| Karnataka | 19.2 | 20.2 | 17.5 | 7.1 | 8.1 | 5.4 | 12.1 | 12.1 | 12.1 | 38 | 43 | 28 |
| Kerala | 14.8 | 14.8 | 14.8 | 7.0 | 7.1 | 6.7 | 7.8 | 7.7 | 8.1 | 13 | 14 | 10 |
| Lakshadweep | 14.3 | 15.5 | 13.2 | 6.4 | 6.1 | 6.7 | 8.0 | 9.5 | 6.5 | 25 | 23 | 27 |
| Madhya Pradesh | 27.3 | 29.2 | 20.5 | 8.3 | 9.0 | 6.0 | 18.9 | 20.2 | 14.5 | 62 | 67 | 42 |
| Maharashtra | 17.1 | 17.6 | 16.4 | 6.5 | 7.5 | 5.3 | 10.6 | 10.2 | 11.1 | 28 | 34 | 20 |
| Manipur | 14.9 | 14.8 | 15.3 | 4.2 | 4.3 | 4.0 | 10.7 | 10.5 | 11.3 | 14 | 15 | 9 |
| Meghalaya | 24.5 | 26.6 | 14.8 | 7.9 | 8.4 | 5.6 | 16.6 | 18.2 | 9.2 | 55 | 58 | 37 |
| Mizoram | 17.1 | 21.1 | 13.0 | 4.5 | 5.4 | 3.7 | 12.5 | 15.7 | 9.3 | 37 | 47 | 21 |
| Nagaland | 16.8 | 17.0 | 16.0 | 3.6 | 3.7 | 3.3 | 13.2 | 13.3 | 12.7 | 23 | 24 | 20 |
| Odisha | 20.5 | 21.4 | 15.2 | 8.6 | 9.0 | 6.6 | 11.9 | 12.4 | 8.6 | 61 | 63 | 43 |
| Puducherry | 16.7 | 16.7 | 16.7 | 7.4 | 8.2 | 7.0 | 9.3 | 8.5 | 9.6 | 22 | 25 | 21 |
| Punjab | 16.6 | 17.2 | 15.6 | 7.0 | 7.7 | 5.8 | 9.6 | 9.5 | 9.8 | 34 | 37 | 28 |
| Rajasthan | 26.7 | 27.9 | 22.9 | 6.7 | 6.9 | 6.0 | 20.0 | 20.9 | 16.9 | 55 | 61 | 31 |
| Sikkim | 17.8 | 18.1 | 16.1 | 5.6 | 5.9 | 3.8 | 12.3 | 12.3 | 12.3 | 30 | 31 | 19 |
| Tamil Nadu | 15.9 | 16.0 | 15.8 | 7.6 | 8.2 | 6.9 | 8.3 | 7.8 | 8.9 | 24 | 25 | 22 |
| Tripura | 14.9 | 15.6 | 11.5 | 5.0 | 4.8 | 5.7 | 9.9 | 10.8 | 5.8 | 27 | 29 | 19 |
| Uttar Pradesh | 28.3 | 29.2 | 24.2 | 8.1 | 8.5 | 6.3 | 20.2 | 20.7 | 17.9 | 61 | 64 | 44 |
| Uttarakhand | 19.3 | 20.2 | 16.2 | 6.3 | 6.7 | 5.1 | 13.0 | 13.5 | 11.1 | 38 | 41 | 25 |
| West Bengal | 16.8 | 18.6 | 11.9 | 6.0 | 6.0 | 6.3 | 10.7 | 12.6 | 5.6 | 31 | 32 | 25 |
Neonatal and infant demographics


The table below represents the infant mortality rate trends in India, based on sex, over the last 15 years. In the urban areas of India, average male infant mortality rates are slightly higher than average female infant mortality rates.
| Year | Male | Female | Total |
|---|---|---|---|
| 1998 | 69.8 | 73.5 | 71.6 |
| 2005 | 56.3 | 58 | 57 |
| 2009 | 49 | 52 | —N/a |
| 2014 | 43.7 | 37.90 | 40.7 |
| 2018 | 29.95 | 29.88 | 29.94 |
India's 2011 census shows a serious decline in the number of girls under the age of seven – activists posit that eight million female fetuses may have been aborted between 2001 and 2011.
Ethnic groups
- Indo-Aryan (78.0%)
- Dravidian (19.6%)
- Austroasiatic (1.11%)
- Tibeto-Burman (1.01%)
- Others (0.19%)
The national Census of India does not recognise racial or ethnic groups within India, but recognises many of the tribal groups as Scheduled Castes and Tribes (see list of Scheduled Tribes in India). For a list of ethnic groups in the Republic of India (as well as neighbouring countries), see South Asian ethnic groups. According to a 2009 study published by Reich et al., the modern Indian population is composed of two genetically divergent and heterogeneous populations which mixed in ancient times (about 1,200–3,500 BP), known as Ancestral North Indians (ANI) and Ancestral South Indians (ASI). ASI corresponds to the Dravidian-speaking population of southern India, whereas ANI corresponds to the Indo-Aryan-speaking population of northern India. 700,000 people from the United States of any race live in India. Around 150,000 Anglo-Indian people still live in India. India is a country with a vast diversity of ethnic groups, each with its own distinct culture, language, and traditions. The major ethnic groups in India include the Indo-Aryans, Dravidians, Sino-Tibetans, Austroasiatic peoples, and various indigenous tribes. These groups are spread across different regions of India, each contributing to the country's rich cultural mosaic.
Population size and structure

India occupies 2.41% of the world's land area but supports over 18% of the world's population. At the 2001 census 72.2% of the population lived in about 638,000 villages and the remaining 27.8% lived in more than 5,100 towns and over 380 urban agglomerations. By 2011, the share of the population living in rural areas decreased to 68.84%, while that of those living in urban areas increased to 31.16%. India's population exceeded that of the entire continent of Africa by 200 million people in 2010. However, because Africa's population growth is extremely high compared to the rest of the world, it is expected to surpass both China and India by the early 2030s. Comparative demographics
| Category | Global ranking | References |
|---|---|---|
| Area | 7th | |
| Population | 1st | |
| Population growth rate | 102nd of 212 | in 2010 |
| Population density | 24th of 212 | in 2010 |
| Male to Female ratio, at birth | 12th of 214 | in 2009 |
| Census year | Population | Change (%) |
|---|---|---|
| 1951 | 361,088,003 | – |
| 1961 | 439,235,000 | 21.6 |
| 1971 | 548,160,000 | 24.8 |
| 1981 | 683,329,000 | 24.7 |
| 1991 | 846,387,888 | 23.9 |
| 2001 | 1,028,737,436 | 21.5 |
| 2011 | 1,210,193,422 | 17.7 |
List of states and union territories by demographics
| Rank | State/UT | Population | Percent (%) | Male | Female | Difference between male and female | Sex ratio | Rural | Urban | Area (km2) | Density (per km2) |
|---|---|---|---|---|---|---|---|---|---|---|---|
| 1 | Uttar Pradesh | 199,812,341 | 16.50 | 104,480,510 | 95,331,831 | 9,148,679 | 930 | 155,111,022 | 44,470,455 | 240,928 | 828 |
| 2 | Maharashtra | 112,374,333 | 9.28 | 58,243,056 | 54,131,277 | 4,111,779 | 929 | 61,545,441 | 50,827,531 | 307,713 | 365 |
| 3 | Bihar | 104,099,452 | 8.60 | 54,278,157 | 49,821,295 | 4,456,862 | 918 | 92,075,028 | 11,729,609 | 94,163 | 1,102 |
| 4 | West Bengal | 91,276,115 | 7.54 | 46,809,027 | 44,467,088 | 2,341,939 | 950 | 62,213,676 | 29,134,060 | 88,752 | 1,030 |
| 5 | Madhya Pradesh | 72,626,809 | 6.00 | 37,612,306 | 35,014,503 | 2,597,803 | 931 | 52,537,899 | 20,059,666 | 308,245 | 236 |
| 6 | Tamil Nadu | 72,147,030 | 5.96 | 36,137,975 | 36,009,055 | 128,920 | 996 | 37,189,229 | 34,949,729 | 130,058 | 555 |
| 7 | Rajasthan | 68,548,437 | 5.66 | 35,550,997 | 32,997,440 | 2,553,557 | 928 | 51,540,236 | 17,080,776 | 342,239 | 201 |
| 8 | Karnataka | 61,095,297 | 5.05 | 30,966,657 | 30,128,640 | 838,017 | 973 | 37,552,529 | 23,578,175 | 191,791 | 319 |
| 9 | Gujarat | 60,439,692 | 4.99 | 31,491,260 | 28,948,432 | 2,542,828 | 919 | 34,670,817 | 25,712,811 | 196,024 | 308 |
| 10 | Andhra Pradesh | 49,386,799 | 4.08 | 24,738,068 | 24,648,731 | 89,337 | 996 | 34,776,389 | 14,610,410 | 160,205 | 308 |
| 11 | Odisha | 41,974,218 | 3.47 | 21,212,136 | 20,762,082 | 450,054 | 979 | 34,951,234 | 6,996,124 | 155,707 | 269 |
| 12 | Telangana | 35,193,978 | 2.91 | 17,704,078 | 17,489,900 | 214,178 | 988 | 21,585,313 | 13,608,665 | 114,840 | 307 |
| 13 | Kerala | 33,406,061 | 2.76 | 16,027,412 | 17,378,649 | −1,351,237 | 1084 | 17,445,506 | 15,932,171 | 38,863 | 859 |
| 14 | Jharkhand | 32,988,134 | 2.72 | 16,930,315 | 16,057,819 | 872,496 | 948 | 25,036,946 | 7,929,292 | 79,714 | 414 |
| 15 | Assam | 31,205,576 | 2.58 | 15,939,443 | 15,266,133 | 673,310 | 958 | 26,780,526 | 4,388,756 | 78,438 | 397 |
| 16 | Punjab | 27,743,338 | 2.29 | 14,639,465 | 13,103,873 | 1,535,592 | 895 | 17,316,800 | 10,387,436 | 50,362 | 550 |
| 17 | Chhattisgarh | 25,545,198 | 2.11 | 12,832,895 | 12,712,303 | 120,592 | 991 | 19,603,658 | 5,936,538 | 135,191 | 189 |
| 18 | Haryana | 25,351,462 | 2.09 | 13,494,734 | 11,856,728 | 1,638,006 | 879 | 16,531,493 | 8,821,588 | 44,212 | 573 |
| 19 | Delhi (UT) | 16,787,941 | 1.39 | 8,887,326 | 7,800,615 | 1,086,711 | 868 | 944,727 | 12,905,780 | 1,484 | 11,297 |
| 20 | Jammu and Kashmir | 12,541,302 | 1.04 | 6,640,662 | 5,900,640 | 740,022 | 889 | 9,134,820 | 3,414,106 | 222,236 | 56 |
| 21 | Uttarakhand | 10,086,292 | 0.83 | 5,137,773 | 4,948,519 | 189,254 | 963 | 7,025,583 | 3,091,169 | 53,483 | 189 |
| 22 | Himachal Pradesh | 6,864,602 | 0.57 | 3,481,873 | 3,382,729 | 99,144 | 972 | 6,167,805 | 688,704 | 55,673 | 123 |
| 23 | Tripura | 3,673,917 | 0.30 | 1,874,376 | 1,799,541 | 74,835 | 960 | 2,710,051 | 960,981 | 10,486 | 350 |
| 24 | Meghalaya | 2,966,889 | 0.25 | 1,491,832 | 1,475,057 | 16,775 | 989 | 2,368,971 | 595,036 | 22,429 | 132 |
| 25 | Manipur | 2,855,794 | 0.24 | 1,438,687 | 1,417,107 | 21,580 | 985 | 1,899,624 | 822,132 | 22,327 | 128 |
| 26 | Nagaland | 1,978,502 | 0.16 | 1,024,649 | 953,853 | 70,796 | 931 | 1,406,861 | 573,741 | 16,579 | 119 |
| 27 | Goa | 1,458,545 | 0.12 | 739,140 | 719,405 | 19,735 | 973 | 551,414 | 906,309 | 3,702 | 394 |
| 28 | Arunachal Pradesh | 1,383,727 | 0.11 | 713,912 | 669,815 | 44,097 | 938 | 1,069,165 | 313,446 | 83,743 | 17 |
| 29 | Puducherry (UT) | 1,247,953 | 0.10 | 612,511 | 635,442 | −22,931 | 1037 | 394,341 | 850,123 | 479 | 2,598 |
| 30 | Mizoram | 1,097,206 | 0.09 | 555,339 | 541,867 | 13,472 | 976 | 529,037 | 561,997 | 21,081 | 52 |
| 31 | Chandigarh (UT) | 1,055,450 | 0.09 | 580,663 | 474,787 | 105,876 | 818 | 29,004 | 1,025,682 | 114 | 9,252 |
| 32 | Sikkim | 610,577 | 0.05 | 323,070 | 287,507 | 35,563 | 890 | 455,962 | 151,726 | 7,096 | 86 |
| 33 | Andaman and Nicobar Islands (UT) | 380,581 | 0.03 | 202,871 | 177,710 | 25,161 | 876 | 244,411 | 135,533 | 8,249 | 46 |
| 34 | Dadra and Nagar Haveli (UT) | 343,709 | 0.03 | 193,760 | 149,949 | 43,811 | 774 | 183,024 | 159,829 | 491 | 698 |
| 35 | Daman and Diu (UT) | 243,247 | 0.02 | 150,301 | 92,946 | 57,355 | 618 | 60,331 | 182,580 | 112 | 2,169 |
| 36 | Lakshadweep (UT) | 64,473 | 0.01 | 33,123 | 31,350 | 1,773 | 946 | 14,121 | 50,308 | 32 | 2,013 |
| – | Total (India) | 1,210,854,977 | 100 | 623,724,248 | 586,469,174 | 35,585,741 | 943 | 833,087,662 | 377,105,760 | 3,287,240 | 382 |
Literacy rate

| State or UT code | State or UT | Overall (%) | Male (%) | Female (%) |
|---|---|---|---|---|
| 1 | Jammu and Kashmir | 68.74% | 76.75% | 58.01% |
| 2 | Himachal Pradesh | 83.78% | 90.83% | 76.60% |
| 3 | Punjab | 75.84% | 81.48% | 71.34% |
| 4 | Chandigarh | 86.43% | 90.54% | 81.38% |
| 5 | Uttarakhand | 79.63% | 88.33% | 70.70% |
| 6 | Haryana | 76.64% | 85.38% | 66.77% |
| 7 | Delhi | 86.34% | 91.03% | 80.93% |
| 8 | Rajasthan | 67.06% | 80.51% | 52.66% |
| 9 | Uttar Pradesh | 69.72% | 79.24% | 59.26% |
| 10 | Bihar | 63.82% | 73.39% | 53.33% |
| 11 | Sikkim | 82.20% | 87.29% | 76.43% |
| 12 | Arunachal Pradesh | 66.95% | 73.69% | 59.57% |
| 13 | Nagaland | 80.11% | 83.29% | 76.69% |
| 14 | Manipur | 79.85% | 86.49% | 73.17% |
| 15 | Mizoram | 91.58% | 93.72% | 89.40% |
| 16 | Tripura | 87.75% | 92.18% | 83.15% |
| 17 | Meghalaya | 75.48% | 77.17% | 73.78% |
| 18 | Assam | 73.18% | 78.81% | 67.27% |
| 19 | West Bengal | 77.08% | 82.67% | 71.16% |
| 20 | Jharkhand | 67.63% | 78.45% | 56.21% |
| 21 | Odisha | 72.90% | 82.40% | 64.36% |
| 22 | Chhattisgarh | 71.04% | 81.45% | 60.59% |
| 23 | Madhya Pradesh | 70.63% | 80.53% | 60.02% |
| 24 | Gujarat | 79.31% | 87.23% | 70.73% |
| 25 | Daman and Diu | 87.07% | 91.48% | 79.59% |
| 26 | Dadra and Nagar Haveli | 77.65% | 86.46% | 65.93% |
| 27 | Maharashtra | 83.20% | 89.82% | 75.48% |
| 28 | Andhra Pradesh | 67.35% | 74.77% | 59.96% |
| 29 | Karnataka | 75.60% | 82.85% | 68.13% |
| 30 | Goa | 87.40% | 92.81% | 81.84% |
| 31 | Lakshadweep | 92.28% | 96.11% | 88.25% |
| 32 | Kerala | 93.91% | 96.02% | 91.98% |
| 33 | Tamil Nadu | 80.33% | 86.81% | 73.86% |
| 34 | Puducherry | 86.55% | 92.12% | 81.22% |
| 35 | Andaman and Nicobar Islands | 86.27% | 90.11% | 81.84% |
| – | Overall (India) | 74.03% | 82.14% | 65.46% |
| Age group | Male | Female | Total | Percentage (%) | Cumulative percentage |
|---|---|---|---|---|---|
| 0–4 | 58,632,074 | 54,174,704 | 112,806,778 | 9.32 | 9.32 |
| 5–9 | 66,300,466 | 60,627,660 | 126,928,126 | 10.48 | 19.8 |
| 10–14 | 69,418,835 | 63,290,377 | 132,709,212 | 10.96 | 30.76 |
| 15–19 | 63,982,396 | 56,544,053 | 120,526,449 | 9.95 | 40.71 |
| 20–24 | 57,584,693 | 53,839,529 | 111,424,222 | 9.20 | 49.91 |
| 25–29 | 51,344,208 | 50,069,757 | 101,413,965 | 8.38 | 58.29 |
| 30–34 | 44,660,674 | 43,934,277 | 88,594,951 | 7.32 | 65.61 |
| 35–39 | 42,919,381 | 42,221,303 | 85,140,684 | 7.03 | 72.64 |
| 40–44 | 37,545,386 | 34,892,726 | 72,438,112 | 5.98 | 78.62 |
| 45–49 | 32,138,114 | 30,180,213 | 62,318,327 | 5.15 | 83.77 |
| 50–54 | 25,843,266 | 23,225,988 | 49,069,254 | 4.05 | 87.82 |
| 55–59 | 19,456,012 | 19,690,043 | 39,146,055 | 3.23 | 91.05 |
| 60–64 | 18,701,749 | 18,961,958 | 37,663,707 | 3.11 | 94.16 |
| 65–69 | 12,944,326 | 13,510,657 | 26,454,983 | 2.18 | 96.34 |
| 70–74 | 9,651,499 | 9,557,343 | 19,208,842 | 1.59 | 97.93 |
| 75–79 | 4,490,603 | 4,741,900 | 9,232,503 | 0.76 | 98.69 |
| 80–84 | 2,927,040 | 3,293,189 | 6,220,229 | 0.51 | 99.2 |
| 85–89 | 1,120,106 | 1,263,061 | 2,383,167 | 0.20 | 99.4 |
| 90–94 | 652,465 | 794,069 | 1,446,534 | 0.12 | 99.52 |
| 95–99 | 294,759 | 338,538 | 633,297 | 0.05 | 99.57 |
| 100+ | 289,325 | 316,453 | 605,778 | 0.05 | 99.62 |
| Unknown | 2,372,881 | 2,116,921 | 4,489,802 | 0.37 | 99.99 |
| Total | 623,270,258 | 587,584,719 | 1,210,854,977 | 100.00 | |
| Age group | Male | Female | Total | Percent | |
| 0–14 | 194,351,375 | 178,092,741 | 372,444,116 | 30.76 | |
| 15–64 | 394,175,879 | 373,559,847 | 767,735,726 | 63.40 | |
| 65+ | 32,370,123 | 33,815,210 | 66,185,333 | 5.47 |
| Age group | Male | Female | Total | % |
|---|---|---|---|---|
| Total | 664,184,000 | 626,890,000 | 1,291,074,000 | 100 |
| 0–4 | 62,872,000 | 56,038,000 | 118,910,000 | 9.21 |
| 5–9 | 61,499,000 | 56,969,000 | 118,468,000 | 9.18 |
| 10–14 | 65,142,000 | 59,682,000 | 124,824,000 | 9.67 |
| 15–19 | 67,223,000 | 60,871,000 | 128,094,000 | 9.92 |
| 20–24 | 63,521,000 | 57,356,000 | 120,877,000 | 9.36 |
| 25–29 | 57,272,000 | 53,357,000 | 110,629,000 | 8.57 |
| 30–34 | 50,782,000 | 49,250,000 | 100,032,000 | 7.75 |
| 35–39 | 45,318,000 | 44,787,000 | 90,105,000 | 6.98 |
| 40–44 | 41,280,000 | 40,497,000 | 81,777,000 | 6.33 |
| 45–49 | 36,602,000 | 35,107,000 | 71,709,000 | 5.55 |
| 50–54 | 30,738,000 | 29,016,000 | 59,754,000 | 4.63 |
| 55–59 | 24,403,000 | 23,307,000 | 47,710,000 | 3.70 |
| 60–64 | 19,133,000 | 19,288,000 | 38,421,000 | 2.98 |
| 65–69 | 15,198,000 | 16,114,000 | 31,312,000 | 2.43 |
| 70–74 | 11,002,000 | 11,723,000 | 22,725,000 | 1.76 |
| 75–79 | 7,703,000 | 8,367,000 | 16,070,000 | 1.24 |
| 80+ | 4,496,000 | 5,161,000 | 9,657,000 | 0.75 |
| Age group | Male | Female | Total | Percent |
| 0–14 | 189,513,000 | 172,689,000 | 362,202,000 | 28.05 |
| 15–64 | 436,272,000 | 412,836,000 | 849,108,000 | 65.77 |
| 65+ | 38,399,000 | 41,365,000 | 79,764,000 | 6.18 |
| Age group | Male | Female | Total | % |
|---|---|---|---|---|
| Total | 700,623,000 | 662,383,000 | 1,363,006,000 | 100 |
| 0–4 | 60,153,000 | 54,120,000 | 114,273,000 | 8.38 |
| 5–9 | 62,276,000 | 55,390,000 | 117,666,000 | 8.63 |
| 10–14 | 61,266,000 | 56,785,000 | 118,051,000 | 8.66 |
| 15–19 | 64,862,000 | 59,420,000 | 124,282,000 | 9.12 |
| 20–24 | 66,770,000 | 60,474,000 | 127,244,000 | 9.34 |
| 25–29 | 62,944,000 | 56,956,000 | 119,900,000 | 8.80 |
| 30–34 | 56,614,000 | 52,961,000 | 109,575,000 | 8.04 |
| 35–39 | 50,027,000 | 48,836,000 | 98,863,000 | 7.25 |
| 40–44 | 44,450,000 | 44,315,000 | 88,765,000 | 6.51 |
| 45–49 | 40,204,000 | 39,903,000 | 80,107,000 | 5.88 |
| 50–54 | 35,235,000 | 34,331,000 | 69,566,000 | 5.10 |
| 55–59 | 29,082,000 | 28,062,000 | 57,144,000 | 4.19 |
| 60–64 | 22,465,000 | 22,079,000 | 44,544,000 | 3.27 |
| 65–69 | 16,823,000 | 17,583,000 | 34,406,000 | 2.52 |
| 70–74 | 12,546,000 | 13,904,000 | 26,450,000 | 1.94 |
| 75–79 | 8,269,000 | 9,294,000 | 17,563,000 | 1.29 |
| 80+ | 6,637,000 | 7,970,000 | 14,607,000 | 1.07 |
| Age group | Male | Female | Total | Percent |
| 0–14 | 183,695,000 | 166,295,000 | 349,990,000 | 25.68 |
| 15–64 | 472,653,000 | 447,337,000 | 919,990,000 | 67.50 |
| 65+ | 44,275,000 | 48,751,000 | 93,026,000 | 6.83 |
| State or UT code | State or UT | Total | Male | Female | Difference |
|---|---|---|---|---|---|
| 1 | Jammu and Kashmir | 2,008,670 | 1,080,662 | 927,982 | 152,680 |
| 2 | Himachal Pradesh | 763,864 | 400,681 | 363,183 | 37,498 |
| 3 | Punjab | 2,941,570 | 1,593,262 | 1,348,308 | 244,954 |
| 4 | Chandigarh | 117,953 | 63,187 | 54,766 | 8,421 |
| 5 | Uttarakhand | 1,328,844 | 704,769 | 624,075 | 80,694 |
| 6 | Haryana | 3,297,724 | 1,802,047 | 1,495,677 | 306,370 |
| 7 | Delhi | 1,970,510 | 1,055,735 | 914,775 | 140,960 |
| 8 | Rajasthan | 10,504,916 | 5,580,212 | 4,924,004 | 656,208 |
| 9 | Uttar Pradesh | 29,728,235 | 15,653,175 | 14,075,060 | 1,578,115 |
| 10 | Bihar | 18,582,229 | 9,615,280 | 8,966,949 | 648,331 |
| 11 | Sikkim | 61,077 | 31,418 | 29,659 | 1,759 |
| 12 | Arunachal Pradesh | 202,759 | 103,430 | 99,330 | 4,100 |
| 13 | Nagaland | 285,981 | 147,111 | 138,870 | 8,241 |
| 14 | Manipur | 353,237 | 182,684 | 170,553 | 12,131 |
| 15 | Mizoram | 165,536 | 83,965 | 81,571 | 2,394 |
| 16 | Tripura | 444,055 | 227,354 | 216,701 | 10,653 |
| 17 | Meghalaya | 555,822 | 282,189 | 273,633 | 8,556 |
| 18 | Assam | 4,511,307 | 2,305,088 | 2,206,219 | 98,869 |
| 19 | West Bengal | 10,112,599 | 5,187,264 | 4,925,335 | 261,929 |
| 20 | Jharkhand | 5,237,582 | 2,695,921 | 2,541,661 | 154,260 |
| 21 | Odisha | 5,035,650 | 2,603,208 | 2,432,442 | 170,766 |
| 22 | Chhattisgarh | 3,584,028 | 1,824,987 | 1,759,041 | 65,946 |
| 23 | Madhya Pradesh | 10,548,295 | 5,516,957 | 5,031,338 | 485,619 |
| 24 | Gujarat | 7,564,464 | 3,974,286 | 3,519,890 | 454,396 |
| 25 | Daman and Diu | 25,880 | 13,556 | 12,314 | 1,242 |
| 26 | Dadra and Nagar Haveli | 49,196 | 25,575 | 23,621 | 1,954 |
| 27 | Maharashtra | 12,848,375 | 6,822,262 | 6,026,113 | 796,149 |
| 28 | Andhra Pradesh | 8,642,686 | 4,448,330 | 4,194,356 | 253,974 |
| 29 | Karnataka | 6,855,801 | 3,527,844 | 3,327,957 | 199,887 |
| 30 | Goa | 139,495 | 72,669 | 66,826 | 5,843 |
| 31 | Lakshadweep | 7,088 | 3,715 | 3,373 | 342 |
| 32 | Kerala | 3,322,247 | 1,695,889 | 1,626,358 | 69,531 |
| 33 | Tamil Nadu | 6,894,821 | 3,542,351 | 3,352,470 | 189,881 |
| 34 | Puducherry | 127,610 | 64,932 | 62,678 | 2,254 |
| 35 | Andaman and Nicobar Islands | 39,497 | 20,094 | 19,403 | 691 |
| – | Total (India) | 158,789,287 | 82,952,135 | 75,837,152 | 7,114,983 |
| State or UT code | State or UT | Total | Male | Female |
|---|---|---|---|---|
| 1 | Jammu and Kashmir | – | – | – |
| 2 | Himachal Pradesh | – | – | – |
| 3 | Punjab | – | – | – |
| 4 | Chandigarh | – | – | – |
| 5 | Uttarakhand | – | – | – |
| 6 | Haryana | 22,055,357 | 11,703,083 | 10,352,274 |
| 7 | Delhi | 14,782,725 | 7,920,675 | 6,862,050 |
| 8 | Rajasthan | 58,116,096 | 30,039,874 | 28,076,222 |
| 9 | Uttar Pradesh | 169,853,242 | 88,943,240 | 80,910,002 |
| 10 | Bihar | 85,222,408 | 44,570,067 | 40,652,341 |
| 11 | Sikkim | 546,611 | 290,243 | 256,368 |
| 12 | Arunachal Pradesh | 1,179,852 | 616,802 | 563,050 |
| 13 | Nagaland | 1,694,621 | 878,596 | 816,025 |
| 14 | Manipur | 2,368,519 | 1,187,080 | 1,181,439 |
| 15 | Mizoram | 925,478 | 468,374 | 457,104 |
| 16 | Tripura | 3,226,977 | 1,644,513 | 1,582,464 |
| 17 | Meghalaya | 2,408,185 | 1,210,479 | 1,197,706 |
| 18 | Assam | 26,657,965 | 13,649,839 | 13,008,126 |
| 19 | West Bengal | 81,235,137 | 41,740,125 | 39,495,012 |
| 20 | Jharkhand | 27,728,656 | 14,235,767 | 13,492,889 |
| 21 | Odisha | 36,911,708 | 18,598,470 | 18,313,238 |
| 22 | Chhattisgarh | 21,956,168 | 11,002,928 | 10,953,240 |
| 23 | Madhya Pradesh | 62,049,270 | 32,095,963 | 29,953,307 |
| 24 | Gujarat | 52,889,452 | 27,507,996 | 25,381,456 |
| 25 | Daman and Diu | 217,031 | 136,544 | 80,487 |
| 26 | Dadra and Nagar Haveli | 293,657 | 167,603 | 126,054 |
| 27 | Maharashtra | 99,524,597 | 51,539,135 | 47,985,462 |
| 28 | Andhra Pradesh | 76,022,847 | 38,061,551 | 37,961,296 |
| 29 | Karnataka | 54,274,903 | 27,529,898 | 26,745,005 |
| 30 | Goa | 1,318,228 | 668,042 | 650,186 |
| 31 | Lakshadweep | 57,341 | 29,391 | 27,950 |
| 32 | Kerala | – | – | – |
| 33 | Tamil Nadu | 65,244,137 | 32,616,520 | 32,627,617 |
| 34 | Puducherry | 1,116,854 | 545,553 | 571,301 |
| 35 | Andaman and Nicobar Islands | 340,447 | 182,236 | 158,211 |
| – | Total (India) | 1,051,404,135 | 540,772,113 | 510,632,022 |
Religion
Based on the latest Census Data
- Hindus (79.8%)
- Muslims (14.2%)
- Christians (2.31%)
- Sikhs (1.72%)
- Buddhists (0.69%)
- Jains (0.37%)
- Other Religions and Persuasions (0.66%)
- Religion Not Stated (0.24%)
Population pyramid by religion


The table below summarises India's demographics (excluding the Mao-Maram, Paomata and Purul subdivisions of Senapati district of Manipur state due to cancellation of census results) according to religion at the 2011 census in per cent. The data are "unadjusted" (without excluding Assam and Jammu and Kashmir); the 1981 census was not conducted in Assam and the 1991 census was not conducted in Jammu and Kashmir.
| Religion | Population | Percentage (%) |
|---|---|---|
| Hindus | 966,378,868 | 79.80% |
| Muslims | 172,245,158 | 14.23% |
| Christians | 27,819,588 | 2.30% |
| Sikhs | 20,833,116 | 1.72% |
| Buddhists | 8,442,972 | 0.70% |
| Jains | 4,451,753 | 0.37% |
| Others | 7,937,734 | 0.66% |
| Not Stated | 2,867,303 | 0.24% |
| Year | Hindus | Muslims | Christians | Sikhs | Buddhists | Jainis | Zoroastrians | Others/ Religion not specified |
|---|---|---|---|---|---|---|---|---|
| 1951 | 84.1% | 9.8% | 2.3% | 1.79% | 0.74% | 0.46% | 0.13% | 0.43% |
| 1961 | 83.45% | 10.69% | 2.44% | 1.79% | 0.74% | 0.46% | 0.09% | 0.43% |
| 1971 | 82.73% | 11.21% | 2.60% | 1.89% | 0.70% | 0.48% | 0.09% | 0.41% |
| 1981 | 82.30% | 11.75% | 2.44% | 1.92% | 0.70% | 0.47% | 0.09% | 0.42% |
| 1991 | 81.53% | 12.61% | 2.32% | 1.94% | 0.77% | 0.40% | 0.08% | 0.44% |
| 2001 | 80.46% | 13.43% | 2.34% | 1.87% | 0.77% | 0.41% | 0.06% | 0.72% |
| 2011 | 79.80% | 14.23% | 2.30% | 1.72% | 0.70% | 0.37% | —N/a | 0.9% |
| Religious group | Population (2011) % | Growth (2001–2011) | Sex ratio (2011) | Literacy (2011) (%) | Work participation (2011) (%) | |||
|---|---|---|---|---|---|---|---|---|
| total | rural | urban | child | |||||
| Hinduism | 79.80% | 16.8% | 939 | 946 | 921 | 913 | 73.3% | 41.0% |
| Islam | 14.23% | 24.6% | 951 | 957 | 941 | 943 | 68.5% | 32.6% |
| Christianity | 2.30% | 15.5% | 1023 | 1008 | 1046 | 958 | 84.5% | 41.9% |
| Sikhism | 1.72% | 8.4% | 903 | 905 | 898 | 828 | 75.4% | 36.3% |
| Buddhism | 0.70% | 6.1% | 965 | 960 | 973 | 933 | 81.3% | 43.1% |
| Jainism | 0.37% | 5.4% | 954 | 935 | 959 | 889 | 94.9% | 35.5% |
| Others/Religion Not Specified | 0.90% | n/a | 959 | 947 | 975 | 974 | n/a | n/a |

Caste/tribe
Caste and community statistics as recorded from "Socially and Educationally Backward Classes Commission" (SEBC) or Mandal Commission of 1979, which was completed in 1983.
India has chosen not to officially count caste population since then.
The following data are from the Mandal report:[citation needed]
| Caste/Tribe | Population | Percentage | Notes |
|---|---|---|---|
| Total population | 731,000,000 | 100% | *Margin of error 0.34% |
| Scheduled castes and tribes | 164,913,600 | 22.56% | |
| Scheduled castes | 110,015,500 | 15.05% | |
| Scheduled tribes | 54,898,100 | 7.51% | |
| Non OBC/SC/ST Hindu castes/communities | 128,509,800 | 17.58% | |
| Brahmin (including Bhumihar) | 40,351,200 | 5.52% | |
| Kshtriyas(Rajput) | 28,509,000 | 3.90% | |
| Maratha | 16,155,100 | 2.21% | |
| Jats | 7,310,000 | 1% | |
| Vaishya, Bania, etc. | 13,742,800 | 1.88% | |
| Kayasthas | 7,821,700 | 1.07% | |
| Others [ Including Yadavs (Kshtriyas) ] | 14,620,000 | 2% | |
| Non-Hindu communities and groups | 121,346,000 | 16.6% | Non-Hindu scheduled and OBC |
| Muslim (Non S.T) | 81,798,900 | 11.19% | 0.02% |
| Christian (Non S.T) | 15,789,600 | 2.16% | 0.44% |
| Sikh (Non scheduled) | 12,207,700 | 1.67% | 0.22% |
| Buddhist (Non S.T) | 4,897,700 | 0.67% | 0.03% |
| Jain (Non scheduled) | 3,435,700 | 0.47% | |
| Other backward classes and communities (OBC) | 380,120,000 | 52% | *OBC is a derived figure |
| Hindu OBC | 318,716,000 | 43.60% | |
| Non-Hindu OBC | 61,404,000 | 8.40% | *52% of Non-Hindus |
Largest cities of India
| Largest cities or towns in India 2011 Census of India | |||||||
|---|---|---|---|---|---|---|---|
| Rank | Name | State/UT | Pop. | Rank | Name | State/UT | Pop. |
| 1 | Mumbai | Maharashtra | 12,478,447 | 11 | Kanpur | Uttar Pradesh | 2,920,067 |
| 2 | Delhi | Delhi | 11,007,835 | 12 | Lucknow | Uttar Pradesh | 2,901,474 |
| 3 | Chennai | Tamil Nadu | 8,696,010 | 13 | Nagpur | Maharashtra | 2,405,421 |
| 4 | Bengaluru | Karnataka | 8,425,970 | 14 | Indore | Madhya Pradesh | 1,960,521 |
| 5 | Hyderabad | Telangana | 6,809,970 | 15 | Thane | Maharashtra | 1,818,872 |
| 6 | Ahmedabad | Gujarat | 5,570,585 | 16 | Bhopal | Madhya Pradesh | 1,795,648 |
| 7 | Kolkata | West Bengal | 4,486,679 | 17 | Visakhapatnam | Andhra Pradesh | 1,730,320 |
| 8 | Surat | Gujarat | 4,462,002 | 18 | Pimpri-Chinchwad | Maharashtra | 1,729,359 |
| 9 | Pune | Maharashtra | 3,115,431 | 19 | Patna | Bihar | 1,683,200 |
| 10 | Jaipur | Rajasthan | 3,073,350 | 20 | Vadodara | Gujarat | 1,670,806 |
Charts
See also
Government
Lists
- List of states and union territories of India by population
- List of states and union territories of India by fertility rate
- List of Indian states by life expectancy at birth
- List of cities in India by population
- List of metropolitan areas in India
- List of million-plus urban agglomerations in India
Notes
Bibliography
- Arnold, David. Pandemic India: From Cholera to COVID-19 (Oxford University Press, 2022). Venkatesh, Archana (January 2023). . H-Net Reviews.
- Chakravorty, Swastika, Srinivas Goli, and Kuriath S. James. "". Sage Open 11.2 (2021): doi:.
- Chamie, Joseph; Mirkin, Barry (August 2017), , Quartz, archived from on 16 August 2017. Joseph Chamie is former director of the United Nations Population Division and Barry Mirkin is former chief of the Population Policy Section of the United Nations Population Division.
- Chandrasekhar, S., and Ajay Sharma. "[dead link]". Spatial demography 3.2 (2015): 63–89.
- Sekher, T. V. "Rural demography of India". in International handbook of rural demography (Springer, Dordrecht, 2012) pp. 169–189.
- Smith, Robert D., and Mohandas K. Mallath. "". Journal of Global Oncology 5 (2019): 1–15.
Medieval India
- Lal, K. S. (1978). Growth of Muslim population in medieval India (A.D. 1000–1800). Delhi, Research Publications.
- Lal, K. S. (1995). Growth of scheduled tribes and castes in medieval India. New Delhi: Aditya Prakashan.
External links
- ; government site with detailed data from 2001 census
- ; generates maps based on 2001 census figures
- ; provides sources of demographic data for India
- ; provides maps of social, economic and demographic data of India in 2001
- ; distribution of population amongst states and union territories
- " 1 January 2023 at the Wayback Machine": Country Profile – India
- Based on data from database of UN Population Division.