Demographics of Italy
In-game article clicks load inline without leaving the challenge.

The demography of Italy is monitored by the Italian National Institute of Statistics (Istat).
At the beginning of 2024, Italy had an estimated population of 58.9 million. Its population density, at 195.7 inhabitants per square kilometre (507/sq mi), is higher than both the EU (106.6/km2) and European (72.9/km2) average. However, the distribution of the population is very uneven: the most densely populated areas are the Po Valley (with about a third of the country's population) in northern Italy and the metropolitan areas of Rome and Naples in central and southern Italy; landlocked, rural and mountainous areas are very sparsely populated, notably the Alps and Apennines ranges, the plateaus of Basilicata and Puglia, the inland highlands of Sicily and the Mediterranean island of Sardinia.
The population of the country almost doubled during the 20th century, but the pattern of growth was extremely uneven due to large-scale internal migration from the impoverished, largely rural South to the industrial cities of the North, especially during the Italian economic miracle of the 1950s and 1960s. In addition, after decades of net emigration, since the late 1980s Italy has experienced large-scale international immigration. As a result, in 2024 there were 5.4 million foreign-born residents in the country, or about 9.2% of Italy's total population.
High fertility and birth rates persisted through the 1970s, then declined sharply in the 1980s and 1990s, leading to rapid population aging. At the end of the 2000s, one in five Italians was over 65 years old. In 2024, Italy's total fertility rate was 1.18, well below the EU average (1.38) and one of the lowest in the world.
Since the revision of the Lateran Treaty in 1984, Italy has no official religion, although the Catholic Church enjoys a privileged legal status and plays a prominent role in Italian society and politics. In 2017, 78% of the population identified as Catholic, 15% as non-believers or atheists, 2% as other Christians and 6% adhered to other religions.
Historical overview
1861 to early 20th century

After achieving its unification in 1861, Italy experienced a prolonged period of net emigration, mainly caused by the breakdown of traditional agrarian structures coupled with slow industrialization, that peaked in the years before World War I. Between 1898 and 1914, at the height of Italian diaspora, up to 750,000 Italians left the country every year in search of brighter prospects. As a consequence, significant numbers of people with Italian ancestry are found in Brazil (32 million Italian Brazilians), Argentina (25 million Italian Argentines), United States (18 million Italian Americans), France (5 million Italian French), Venezuela (5 million Italian Venezuelans), Paraguay (2.5 million Italian Paraguayans), Colombia (2 million Italian Colombians), Uruguay (1.5 million Italian Uruguayans), Peru (1.5 million Italian Peruvians), Canada (1.5 million Italian Canadians), Germany (1.2 million Italian Germans) and Australia (1 million Italian Australians).
In addition, Italian communities once thrived in the former Italian colonial empire. There were about 100,000 settlers living in Eritrea and Somalia, and about 150,000 in Libya; that mostly left Africa after World War II and decolonization.
After 1945
Outcomes of World War II and decolonization

After communist Yugoslavia annexed Istria, Kvarner, most of the Julian March as well as the Dalmatian city of Zara following the Treaty of Peace with Italy, 1947, up to 350,000 local ethnic Italians (Istrian Italians and Dalmatian Italians) fled to Italy in the Istrian–Dalmatian exodus. In addition, World War II itself caused half a million military and civilian casualties. Finally, in 1970 about 20,000 Italians were expelled from Libya by Muammar Gaddafi's regime.
Post-war economic miracle
Rapid economic growth in the 1950s, 1960s and early 1970s caused massive inflows of migrants from rural areas of Southern Italy to the so-called "industrial triangle", the area containing the major industrial cities of Milan and Turin and the seaport of Genoa, in north-west Italy. Between 1955 and 1971, around 9 million people are estimated to have been involved in inter-regional migrations, uprooting entire communities and creating large metropolitan areas.
21st century
The rapid transition from agrarian to post-industrial society accelerated numerous demographic trends, including a sharp decline in fertility and birth rates, fast population aging and a shrinking workforce; by the 1980s emigration had all but stopped and Italy started to have a positive net migration rate. By the 1990s, as Italy's TFR dropped below 1.2 and deaths outpaced births, international migration became the main driver of population growth. Foreign-born residents in Italy increased from 1.3 million in 2001, to 4 million in 2011, and 5.2 million in 2021.
In the 2010s, as a combined effect of the global financial crisis, the Eurozone crisis double-dip recession and the Arab Spring, Italy experienced a significant slowdown in legal international migration, that coincided with the arrival of more than 150,000 illegal asylum seekers.
As a direct effect of the 2020-2023 COVID-19 pandemic, Italy registered more than 198,000 excess deaths, while the associated economic uncertainty and disruption of social relations have been linked to a marked decline in fertility rates across numerous Western countries, including Italy. In subsequent years, the average number of births in Italy fell from 494,000 in 2010–19 to 399,000 in 2020–22, while deaths increased from 617,000 to 719,000; as a result, the natural balance declined form -123,000 to -320,000, largely not compensated by net migration, discouraged by COVID-19 restrictions and the Economic impact of the COVID-19 pandemic.
Population

| Year | Pop. | ±% p.a. |
|---|---|---|
| 1861 | 21,777,334 | — |
| 1871 | 26,801,154 | +2.10% |
| 1881 | 28,459,628 | +0.60% |
| 1901 | 32,475,253 | +0.66% |
| 1911 | 34,671,377 | +0.66% |
| 1921 | 37,973,977 | +0.91% |
| 1931 | 41,176,671 | +0.81% |
| 1936 | 42,993,602 | +0.87% |
| 1951 | 47,515,537 | +0.67% |
| 1961 | 50,623,569 | +0.64% |
| 1971 | 54,136,547 | +0.67% |
| 1981 | 56,556,911 | +0.44% |
| 1991 | 56,778,031 | +0.04% |
| 2001 | 56,995,744 | +0.04% |
| 2011 | 59,433,744 | +0.42% |
| 2021 | 59,236,213 | −0.03% |
| 2026 | 58,942,828 | −0.10% |
| Source: ISTAT |
2530354045505560651860189019201950198020102040millionItaly Total Population
Life expectancy


Sources: Our World In Data and the United Nations. 1871–1950
| Years | 1871 | 1872 | 1873 | 1874 | 1875 | 1876 | 1877 | 1878 | 1879 | 1880 |
|---|---|---|---|---|---|---|---|---|---|---|
| Life expectancy | 29.8 | 29.7 | 31.6 | 31.8 | 31.3 | 33.6 | 34.9 | 34.3 | 34.0 | 32.8 |
| Years | 1881 | 1882 | 1883 | 1884 | 1885 | 1886 | 1887 | 1888 | 1889 | 1890 |
| Life expectancy | 34.2 | 34.3 | 35.2 | 36.6 | 36.9 | 35.1 | 36.0 | 37.0 | 39.1 | 38.5 |
| Years | 1891 | 1892 | 1893 | 1894 | 1895 | 1896 | 1897 | 1898 | 1899 | 1900 |
| Life expectancy | 38.5 | 38.9 | 39.8 | 40.0 | 39.6 | 40.7 | 43.3 | 42.3 | 43.7 | 67.8 |
| Years | 1901 | 1902 | 1903 | 1904 | 1905 | 1906 | 1907 | 1908 | 1909 | 1910 |
| Life expectancy | 43.5 | 43.0 | 43.1 | 44.4 | 43.9 | 45.1 | 45.4 | 43.1 | 44.6 | 46.7 |
| Years | 1911 | 1912 | 1913 | 1914 | 1915 | 1916 | 1917 | 1918 | 1919 | 1920 |
| Life expectancy | 44.7 | 48.9 | 48.4 | 49.9 | 42.5 | 39.6 | 38.1 | 25.8 | 42.3 | 45.5 |
| Years | 1921 | 1922 | 1923 | 1924 | 1925 | 1926 | 1927 | 1928 | 1929 | 1930 |
| Life expectancy | 49.2 | 50.0 | 51.4 | 51.5 | 51.3 | 50.9 | 52.5 | 52.6 | 52.3 | 55.2 |
| Years | 1931 | 1932 | 1933 | 1934 | 1935 | 1936 | 1937 | 1938 | 1939 | 1940 |
| Life expectancy | 54.8 | 54.7 | 56.3 | 56.8 | 56.2 | 56.7 | 55.5 | 56.1 | 57.6 | 57.0 |
| Years | 1941 | 1942 | 1943 | 1944 | 1945 | 1946 | 1947 | 1948 | 1949 | 1950 |
| Life expectancy | 54.7 | 52.5 | 49.4 | 52.4 | 54.9 | 59.0 | 61.2 | 63.4 | 64.1 | 65.8 |
1950–2020
| Period | Life expectancy in Years | Period | Life expectancy in Years |
|---|---|---|---|
| 1950–1955 | 66.5 | 1985–1990 | 76.4 |
| 1955–1960 | 68.4 | 1990–1995 | 77.5 |
| 1960–1965 | 69.7 | 1995–2000 | 78.8 |
| 1965–1970 | 70.9 | 2000–2005 | 80.3 |
| 1970–1975 | 72.2 | 2005–2010 | 81.5 |
| 1975–1980 | 73.6 | 2010–2015 | 82.4 |
| 1980–1985 | 74.9 | 2015–2020 | 83.3 |
Source: UN World Population Prospects
Fertility
Italy experienced a short-term growth in fertility and birth rates in the 2000s. The TFR temporarily rose from an all-time low of 1.18 children per woman in 1995 to 1.46 in 2010. By 2024, Italy's TFR dropped again to 1.18. The decline in fertility, that in Italy and Spain is more pronounced that in northern European countries, has long puzzled demographers; some tentative explanations could be rooted in the lack of affordable childcare services and sociocultural norms regarding family building and female work participation.
In 2021 this was 1.47 children born/woman
Mother's mean age at first birth; 31.1 years (2017 est.)
Historical Total Fertility Rate
1234561860189019201950198020102040Total fertility rateItaly TFR

.
Age structure
0-14 years: 0–14 years: 13.45% (male 4,292,431/female 4,097,732)
15-24 years: 9.61% (male 3,005,402/female 2,989,764)
25-54 years: 40.86% (male 12,577,764/female 12,921,614)
55-64 years: 14% (male 4,243,735/female 4,493,581)
65 years and over: 22.08% (male 5,949,560/female 7,831,076) (2020 est.)
10203040506070198019902000201020202030Population <15Population 15-64Population 65+Italy Age Structure (%)
Median age
total: 46.5 years. Country comparison to the world: 5th
male: 45.4 years
female: 47.5 years (2020 est.)
Cities
70.4% of Italian population is classified as urban, a relatively low figure among developed countries. Italy's administrative boundaries have seen significant devolution in recent decades; the metropolitan area was created as a new administrative unit, and major cities and metro areas now have a provincial status.
According to OECD, the largest conurbations are:
Urbanization
urban population: 71% of total population (2020)
rate of urbanization: 0.29% annual rate of change (2015–20 est.)

| Metropolitan city | Region | Area (km2) | Population (1 January 2025) | Functional Urban Areas (FUA) Population (2016) |
|---|---|---|---|---|
| Rome | Lazio | 5,352 | 4,223,885 | 4,414,288 |
| Milan | Lombardy | 1,575 | 3,247,623 | 5,111,481 |
| Naples | Campania | 1,171 | 2,958,410 | 3,418,061 |
| Turin | Piedmont | 6,829 | 2,207,873 | 1,769,475 |
| Palermo | Sicily | 5,009 | 1,194,439 | 1,033,226 |
| Bari | Apulia | 3,821 | 1,218,191 | 749,723 |
| Catania | Sicily | 3,574 | 1,058,563 | 658,805 |
| Florence | Tuscany | 3,514 | 989,460 | 807,896 |
| Bologna | Emilia-Romagna | 3,702 | 1,020,865 | 775,247 |
| Genoa | Liguria | 1,839 | 818,651 | 713,243 |
| Venice | Veneto | 2,462 | 833,934 | 561,697 |
| Messina | Sicily | 3,266 | 595,948 | 273,680 |
| Reggio Calabria | Calabria | 3,183 | 511,935 | 221,139 |
| Cagliari | Sardinia | 1,248 | 417,079 | 488,954 |
Vital statistics
Statistics since 1862
Source:
Notable events in Italian demography:
- 1916-1918 – World War I
| Average population (1 January) | Live births | Deaths | Natural change | Crude birth rate (per 1,000) | Crude death rate (per 1,000) | Natural change (per 1,000) | Crude migration change (per 1,000) | Total fertility rates | |
|---|---|---|---|---|---|---|---|---|---|
| 1862 | 26,328,000 | 991,000 | 815,000 | 176,000 | 37.7 | 30.9 | 6.7 | 4.93 | |
| 1863 | 26,507,000 | 1,026,000 | 824,000 | 202,000 | 38.7 | 31.1 | 7.6 | -0.9 | 4.90 |
| 1864 | 26,712,000 | 1,000,000 | 802,000 | 198,000 | 37.4 | 30.0 | 7.4 | 0.3 | 4.90 |
| 1865 | 26,915,000 | 1,024,000 | 812,000 | 212,000 | 38.0 | 30.1 | 7.9 | -0.3 | 4.91 |
| 1866 | 27,131,000 | 1,044,000 | 798,000 | 246,000 | 38.5 | 29.4 | 9.1 | -1.1 | 4.91 |
| 1867 | 27,381,000 | 991,000 | 935,000 | 56,000 | 36.2 | 34.1 | 2.0 | 7.1 | 4.92 |
| 1868 | 27,440,000 | 964,000 | 844,000 | 120,000 | 35.1 | 30.8 | 4.4 | -2.2 | 4.92 |
| 1869 | 27,561,000 | 1,016,000 | 777,000 | 239,000 | 36.9 | 28.2 | 8.7 | -4.3 | 4.91 |
| 1870 | 27,801,000 | 1,016,000 | 840,000 | 176,000 | 36.5 | 30.2 | 6.3 | 2.3 | 4.90 |
| 1871 | 27,974,000 | 1,026,000 | 845,000 | 181,000 | 36.7 | 30.2 | 6.5 | -0.3 | 4.90 |
| 1872 | 28,151,000 | 1,060,000 | 868,000 | 192,000 | 37.7 | 30.9 | 6.8 | -0.5 | 4.89 |
| 1873 | 28,314,000 | 1,023,000 | 854,000 | 169,000 | 36.1 | 30.1 | 6.0 | -0.2 | 4.88 |
| 1874 | 28,459,000 | 985,000 | 868,000 | 117,000 | 34.6 | 30.5 | 4.1 | 1.0 | 4.89 |
| 1875 | 28,551,000 | 1,072,000 | 885,000 | 187,000 | 37.5 | 31.0 | 6.5 | -3.3 | 4.90 |
| 1876 | 28,709,000 | 1,121,000 | 835,000 | 286,000 | 39.0 | 29.1 | 10.0 | -4.5 | 4.90 |
| 1877 | 28,964,000 | 1,063,000 | 823,000 | 240,000 | 36.7 | 28.4 | 8.3 | 0.5 | 4.91 |
| 1878 | 29,169,000 | 1,046,000 | 850,000 | 196,000 | 35.8 | 29.1 | 6.7 | 0.3 | 4.92 |
| 1879 | 29,334,000 | 1,097,000 | 873,000 | 224,000 | 37.4 | 29.7 | 7.6 | -2.0 | 4.95 |
| 1880 | 29,516,000 | 989,000 | 906,000 | 83,000 | 33.5 | 30.7 | 2.8 | 3.4 | 4.98 |
| 1881 | 29,552,000 | 1,112,000 | 819,000 | 293,000 | 37.7 | 27.7 | 9.9 | -8.7 | 5.00 |
| 1882 | 29,791,000 | 1,090,000 | 825,000 | 265,000 | 36.6 | 27.7 | 8.9 | -0.9 | 5.03 |
| 1883 | 30,005,000 | 1,101,000 | 830,000 | 271,000 | 36.7 | 27.7 | 9.0 | -1.9 | 5.06 |
| 1884 | 30,221,000 | 1,162,000 | 816,000 | 346,000 | 38.5 | 27.0 | 11.4 | -4.3 | 5.05 |
| 1885 | 30,511,000 | 1,156,000 | 823,000 | 333,000 | 37.9 | 27.0 | 10.9 | -1.4 | 5.04 |
| 1886 | 30,776,000 | 1,117,000 | 882,000 | 235,000 | 36.3 | 28.7 | 7.6 | 1.0 | 5.04 |
| 1887 | 30,937,000 | 1,184,000 | 864,000 | 320,000 | 38.2 | 27.9 | 10.4 | -5.2 | 5.03 |
| 1888 | 31,160,000 | 1,149,000 | 855,000 | 294,000 | 36.9 | 27.4 | 9.4 | -2.3 | 5.02 |
| 1889 | 31,325,000 | 1,178,000 | 801,000 | 377,000 | 37.6 | 25.6 | 12.0 | -6.8 | 4.98 |
| 1890 | 31,611,000 | 1,110,000 | 830,000 | 280,000 | 35.1 | 26.2 | 8.9 | 0.2 | 4.95 |
| 1891 | 31,792,000 | 1,159,000 | 829,000 | 330,000 | 36.5 | 26.1 | 10.4 | -4.7 | 4.92 |
| 1892 | 31,992,000 | 1,137,000 | 837,000 | 300,000 | 35.6 | 26.2 | 9.4 | -3.1 | 4.88 |
| 1893 | 32,189,000 | 1,154,000 | 809,000 | 345,000 | 35.9 | 25.2 | 10.7 | -4.6 | 4.84 |
| 1894 | 32,417,000 | 1,130,000 | 808,000 | 322,000 | 34.9 | 24.9 | 10.0 | -2.9 | 4.79 |
| 1895 | 32,608,000 | 1,120,000 | 817,000 | 303,000 | 34.4 | 25.1 | 9.3 | -3.4 | 4.74 |
| 1896 | 32,770,000 | 1,123,000 | 790,000 | 333,000 | 34.3 | 24.1 | 10.2 | -5.2 | 4.69 |
| 1897 | 32,955,000 | 1,128,000 | 725,000 | 403,000 | 34.2 | 22.0 | 12.2 | -6.6 | 4.64 |
| 1898 | 33,200,000 | 1,097,000 | 762,000 | 335,000 | 33.0 | 22.9 | 10.1 | -2.7 | 4.59 |
| 1899 | 33,369,000 | 1,116,000 | 734,000 | 382,000 | 33.5 | 22.0 | 11.4 | -6.4 | 4.56 |
| 1900 | 32,377,000 | 1,067,376 | 768,917 | 298,459 | 33.0 | 23.7 | 9.2 | -3.9 | 4.53 |
| 1901 | 32,550,000 | 1,057,763 | 715,036 | 342,727 | 32.5 | 22.0 | 10.5 | -3.2 | 4.49 |
| 1902 | 32,787,000 | 1,093,074 | 727,181 | 365,893 | 33.3 | 22.2 | 11.2 | -4.6 | 4.46 |
| 1903 | 33,004,000 | 1,042,090 | 736,311 | 305,779 | 31.6 | 22.3 | 9.3 | -2.2 | 4.43 |
| 1904 | 33,237,000 | 1,085,431 | 698,604 | 386,827 | 32.7 | 21.0 | 11.6 | -4.0 | 4.44 |
| 1905 | 33,489,000 | 1,084,518 | 730,340 | 354,178 | 32.4 | 21.8 | 10.6 | -3.8 | 4.45 |
| 1906 | 33,718,000 | 1,070,978 | 696,875 | 374,103 | 31.8 | 20.7 | 11.1 | -4.2 | 4.45 |
| 1907 | 33,952,000 | 1,062,333 | 700,333 | 362,000 | 31.3 | 20.6 | 10.7 | -3.5 | 4.46 |
| 1908 | 34,198,000 | 1,138,813 | 770,054 | 368,759 | 33.3 | 22.5 | 10.8 | -3.3 | 4.47 |
| 1909 | 34,455,000 | 1,115,831 | 738,460 | 377,371 | 32.4 | 21.4 | 11.0 | -2.4 | 4.43 |
| 1910 | 34,751,000 | 1,144,410 | 682,459 | 461,951 | 32.9 | 19.6 | 13.3 | -5.2 | 4.39 |
| 1911 | 35,033,000 | 1,093,545 | 742,811 | 350,734 | 31.2 | 21.2 | 10.0 | -3.9 | 4.36 |
| 1912 | 35,246,000 | 1,133,985 | 635,788 | 498,197 | 32.2 | 18.0 | 14.1 | -11.1 | 4.32 |
| 1913 | 35,351,000 | 1,122,482 | 663,966 | 458,516 | 31.8 | 18.8 | 13.0 | -3.1 | 4.28 |
| 1914 | 35,701,000 | 1,114,091 | 643,355 | 470,736 | 31.2 | 18.0 | 13.2 | 2.8 | 4.04 |
| 1915 | 36,271,000 | 1,109,183 | 809,703 | 299,480 | 30.6 | 22.3 | 8.3 | -2.5 | 3.80 |
| 1916 | 36,481,000 | 881,626 | 854,703 | 26,923 | 24.2 | 23.4 | 0.7 | -4.5 | 3.56 |
| 1917 | 36,343,000 | 691,207 | 948,710 | -257,503 | 19.6 | 26.1 | -7.1 | -4.5 | 3.32 |
| 1918 | 35,922,000 | 640,263 | 1,268,290 | -628,027 | 18.2 | 35.3 | -17.5 | 11.8 | 3.08 |
| 1919 | 35,717,000 | 770,620 | 676,329 | 94,291 | 21.6 | 18.9 | 2.6 | 4.2 | 3.24 |
| 1920 | 35,960,000 | 1,158,041 | 681,749 | 476,292 | 32.2 | 19.0 | 13.2 | 39.9 | 3.41 |
| 1921 | 37,869,000 | 1,118,344 | 670,234 | 448,110 | 30.7 | 17.7 | 13.0 | -4.4 | 3.57 |
| 1922 | 38,196,000 | 1,127,444 | 690,054 | 437,390 | 30.8 | 18.1 | 12.7 | -2.9 | 3.74 |
| 1923 | 38,571,000 | 1,107,505 | 654,827 | 452,678 | 29.9 | 17.0 | 11.7 | -2.5 | 3.90 |
| 1924 | 38,927,000 | 1,124,470 | 663,077 | 461,393 | 28.9 | 17.0 | 11.9 | -3.2 | 3.81 |
| 1925 | 39,265,000 | 1,109,761 | 669,695 | 440,066 | 28.2 | 17.1 | 11.2 | -2.9 | 3.72 |
| 1926 | 39,590,000 | 1,094,587 | 680,274 | 414,313 | 27.7 | 17.2 | 10.5 | -2.0 | 3.64 |
| 1927 | 39,926,000 | 1,093,772 | 639,843 | 453,929 | 27.4 | 16.0 | 11.4 | -2.5 | 3.55 |
| 1928 | 40,281,000 | 1,072,316 | 645,654 | 426,662 | 26.6 | 16.0 | 10.6 | -2.5 | 3.46 |
| 1929 | 40,607,000 | 1,037,700 | 667,223 | 370,477 | 25.6 | 16.4 | 9.1 | -0.5 | 3.42 |
| 1930 | 40,956,000 | 1,092,678 | 576,751 | 515,927 | 26.7 | 14.1 | 12.6 | -3.2 | 3.38 |
| 1931 | 41,339,000 | 1,026,197 | 609,405 | 416,792 | 24.8 | 14.7 | 10.1 | -4.2 | 3.21 |
| 1932 | 41,584,000 | 990,995 | 610,646 | 380,349 | 23.8 | 14.7 | 9.1 | -0.8 | 3.06 |
| 1933 | 41,928,000 | 995,979 | 574,113 | 421,866 | 23.8 | 13.7 | 10.1 | -1.8 | 3.04 |
| 1934 | 42,277,000 | 992,966 | 563,339 | 429,627 | 23.5 | 13.3 | 10.2 | -1.8 | 3.00 |
| 1935 | 42,631,000 | 996,708 | 594,722 | 401,986 | 23.4 | 14.0 | 9.4 | -1.6 | 2.98 |
| 1936 | 42,965,000 | 962,686 | 593,380 | 369,306 | 22.4 | 13.8 | 8.6 | -1.5 | 2.87 |
| 1937 | 43,269,000 | 991,867 | 618,290 | 373,577 | 22.9 | 14.3 | 8.6 | -1.0 | 2.93 |
| 1938 | 43,596,000 | 1,037,180 | 614,988 | 422,192 | 23.8 | 14.1 | 9.7 | 0 | 3.05 |
| 1939 | 44,018,000 | 1,040,213 | 591,483 | 448,730 | 23.6 | 13.4 | 10.2 | 0 | 3.07 |
| 1940 | 44,467,000 | 1,046,479 | 606,907 | 439,572 | 23.5 | 13.6 | 9.9 | -1.7 | 3.07 |
| 1941 | 44,830,000 | 937,546 | 621,735 | 315,811 | 20.9 | 13.9 | 7.0 | -1.0 | 2.74 |
| 1942 | 45,098,000 | 926,063 | 643,607 | 282,456 | 20.5 | 14.3 | 6.3 | -16.4 | 2.69 |
| 1943 | 44,641,000 | 882,105 | 679,708 | 202,397 | 19.8 | 15.2 | 4.5 | -1.1 | 2.61 |
| 1944 | 44,794,000 | 814,746 | 685,171 | 129,575 | 18.3 | 15.3 | 2.9 | 0.5 | 2.39 |
| 1945 | 44,946,000 | 815,678 | 615,092 | 200,586 | 18.2 | 13.7 | 4.5 | 2.3 | 2.37 |
| 1946 | 45,253,000 | 1,036,098 | 547,952 | 488,146 | 23.0 | 12.1 | 10.8 | -2.2 | 3.01 |
| 1947 | 45,641,000 | 1,011,490 | 524,019 | 487,471 | 22.2 | 11.5 | 10.8 | 5.4 | 2.89 |
| 1948 | 46,381,000 | 1,005,851 | 490,450 | 515,401 | 21.8 | 10.6 | 11.2 | -3.6 | 2.83 |
| 1949 | 46,733,000 | 937,146 | 485,277 | 451,869 | 20.1 | 10.4 | 9.7 | -1.8 | 2.62 |
| 1950 | 47,104,000 | 908,622 | 455,169 | 453,453 | 19.3 | 9.7 | 9.6 | -3.0 | 2.50 |
| 1951 | 47,417,000 | 860,998 | 485,208 | 375,790 | 18.2 | 10.2 | 7.9 | -2.6 | 2.35 |
| 1952 | 47,666,000 | 863,661 | 488,470 | 375,191 | 17.7 | 10.0 | 7.7 | -1.6 | 2.34 |
| 1953 | 47,957,000 | 860,345 | 484,527 | 375,818 | 17.5 | 9.9 | 7.6 | -0.5 | 2.31 |
| 1954 | 48,299,000 | 881,845 | 445,902 | 435,943 | 18.0 | 9.1 | 8.9 | -2.0 | 2.35 |
| 1955 | 48,633,000 | 879,130 | 449,058 | 430,072 | 17.9 | 9.2 | 8.7 | -2.8 | 2.33 |
| 1956 | 48,920,000 | 884,043 | 499,504 | 384,539 | 17.9 | 10.2 | 7.7 | -2.4 | 2.34 |
| 1957 | 49,181,000 | 885,812 | 483,558 | 402.254 | 17.9 | 9.8 | 8.0 | -2.0 | 2.33 |
| 1958 | 49,475,000 | 880,361 | 459,366 | 420,995 | 17.6 | 9.3 | 8.3 | -1.1 | 2.31 |
| 1959 | 49,831,000 | 910,628 | 454,547 | 456,081 | 18.1 | 9.1 | 9.0 | -1.6 | 2.38 |
| 1960 | 50,198,000 | 923,004 | 480,848 | 442,156 | 18.1 | 9.6 | 8.6 | -2.1 | 2.41 |
| 1961 | 50,523,000 | 924,203 | 460,009 | 464,194 | 18.4 | 9.3 | 9.1 | -2.1 | 2.41 |
| 1962 | 50,878,000 | 945,842 | 503,106 | 442,736 | 18.4 | 10.0 | 8.4 | -1.1 | 2.46 |
| 1963 | 51,251,000 | 978,143 | 514,000 | 464,143 | 18.8 | 10.1 | 8.7 | -0.4 | 2.56 |
| 1964 | 51,675,000 | 1,035,207 | 488,601 | 546,606 | 19.7 | 9.5 | 10.2 | -1.7 | 2.70 |
| 1965 | 52,112,000 | 1,017,944 | 516,922 | 501,022 | 19.1 | 10.0 | 9.1 | -1.3 | 2.66 |
| 1966 | 52,518,000 | 999,316 | 493,562 | 505,754 | 18.7 | 9.5 | 9.2 | -1.9 | 2.62 |
| 1967 | 52,900,000 | 962,197 | 507,845 | 454,352 | 18.0 | 9.7 | 8.3 | -2.0 | 2.53 |
| 1968 | 53,235,000 | 944,837 | 530,738 | 414,099 | 17.6 | 10.1 | 7.5 | -1.8 | 2.49 |
| 1969 | 53,538,000 | 949,155 | 530,348 | 418,807 | 17.5 | 10.1 | 7.4 | -2.1 | 2.51 |
| 1970 | 53,821,000 | 917,496 | 528,622 | 388,874 | 16.8 | 9.7 | 7.1 | -2.4 | 2.42 |
| 1971 | 54,073,000 | 911,084 | 515,318 | 395,766 | 16.8 | 9.7 | 7.1 | -1.4 | 2.41 |
| 1972 | 54,381,000 | 893,061 | 518,020 | 375,041 | 16.3 | 9.6 | 6.7 | 0.1 | 2.36 |
| 1973 | 54,751,000 | 887,953 | 544,461 | 343,492 | 16.0 | 10.0 | 6.0 | 0.6 | 2.34 |
| 1974 | 55,111,000 | 886,310 | 532,753 | 353,557 | 15.8 | 9.7 | 6.1 | -0.1 | 2.33 |
| 1975 | 55,441,000 | 841,858 | 556,019 | 285,839 | 14.9 | 10.0 | 4.9 | 0.1 | 2.20 |
| 1976 | 55,718,000 | 806,358 | 556,143 | 250,215 | 14.0 | 9.9 | 4.1 | 0.2 | 2.11 |
| 1977 | 55,955,000 | 757,281 | 547,011 | 210,270 | 13.2 | 9.8 | 3.5 | 0.1 | 1.97 |
| 1978 | 56,155,000 | 720,545 | 539,685 | 180,860 | 12.6 | 9.6 | 3.0 | -0.1 | 1.87 |
| 1979 | 56,318,000 | 682,742 | 541,825 | 140,917 | 11.9 | 9.6 | 2.3 | -0.2 | 1.76 |
| 1980 | 56,434,000 | 657,278 | 559,376 | 97,902 | 11.3 | 9.8 | 1.5 | -0.3 | 1.68 |
| 1981 | 56,502,000 | 628,113 | 540,764 | 87,349 | 11.0 | 9.7 | 1.4 | -0.7 | 1.60 |
| 1982 | 56,544,000 | 634,678 | 537,727 | 96,951 | 10.9 | 9.5 | 1.5 | -1.1 | 1.60 |
| 1983 | 56,564,000 | 612,936 | 563,807 | 49,129 | 10.6 | 10.0 | 0.7 | -0.5 | 1.54 |
| 1984 | 56,577,000 | 597,560 | 535,661 | 61,899 | 10.4 | 9.5 | 0.9 | -0.6 | 1.48 |
| 1985 | 56,593,000 | 589,233 | 549,529 | 39,704 | 10.2 | 9.7 | 0.5 | -0.4 | 1.45 |
| 1986 | 56,596,000 | 562,512 | 545,189 | 17,323 | 9.8 | 9.5 | 0.3 | -0.2 | 1.37 |
| 1987 | 56,602,000 | 560,265 | 534,993 | 25,272 | 9.7 | 9.3 | 0.5 | 0 | 1.35 |
| 1988 | 56,629,000 | 577,856 | 537,545 | 40,311 | 10.1 | 9.5 | 0.5 | 0.3 | 1.38 |
| 1989 | 56,672,000 | 567,268 | 531,557 | 35,711 | 9.9 | 9.4 | 0.5 | 0.3 | 1.35 |
| 1990 | 56,719,000 | 580,761 | 544,397 | 36,364 | 10.0 | 9.6 | 0.5 | 0.2 | 1.36 |
| 1991 | 56,759,000 | 556,175 | 547,131 | 9,044 | 9.9 | 9.8 | 0.2 | 0.5 | 1.32 |
| 1992 | 56,797,000 | 575,216 | 545,038 | 30,178 | 10.0 | 9.6 | 0.4 | 0.2 | 1.32 |
| 1993 | 56,832,000 | 552,587 | 555,043 | -2,456 | 9.7 | 9.7 | -0.1 | 0.3 | 1.26 |
| 1994 | 56,843,000 | 536,665 | 557,513 | -20,848 | 9.4 | 9.8 | -0.4 | 0.4 | 1.22 |
| 1995 | 56,844,000 | 526,064 | 555,203 | -29,139 | 9.2 | 9.8 | -0.5 | 0.8 | 1.19 |
| 1996 | 56,860,000 | 536,740 | 557,756 | -21,016 | 9.3 | 9.8 | -0.5 | 1.0 | 1.22 |
| 1997 | 56,890,000 | 540,048 | 564,679 | -24,631 | 9.4 | 9.9 | -0.5 | 0.8 | 1.23 |
| 1998 | 56,907,000 | 532,843 | 576,911 | -44,068 | 9.3 | 10.1 | -0.8 | 1.0 | 1.21 |
| 1999 | 56,917,000 | 537,242 | 571,356 | -34,114 | 9.4 | 10.0 | -0.5 | 0.9 | 1.23 |
| 2000 | 56,942,000 | 543,039 | 560,241 | -17,202 | 9.5 | 9.8 | -0.3 | 0.9 | 1.26 |
| 2001 | 56,974,000 | 535,282 | 548,254 | -12,972 | 9.4 | 9.8 | -0.4 | 1.9 | 1.25 |
| 2002 | 57,059,000 | 538,198 | 557,393 | -19,195 | 9.4 | 9.8 | -0.4 | 4.9 | 1.27 |
| 2003 | 57,313,000 | 544,063 | 586,468 | -42,405 | 9.5 | 10.3 | -0.7 | 7.2 | 1.29 |
| 2004 | 57,685,000 | 562,599 | 546,658 | 15,941 | 9.8 | 9.5 | 0.3 | 4.6 | 1.34 |
| 2005 | 57,969,000 | 554,022 | 567,304 | -13,282 | 9.5 | 9.8 | -0.2 | 3.2 | 1.33 |
| 2006 | 58,144,000 | 560,010 | 557,892 | 2,118 | 9.6 | 9.6 | 0.0 | 5.1 | 1.37 |
| 2007 | 58,438,000 | 563,933 | 570,801 | -6,868 | 9.6 | 9.8 | -0.2 | 6.9 | 1.39 |
| 2008 | 58,827,000 | 576,659 | 585,126 | -8,467 | 9.8 | 9.9 | -0.1 | 4.7 | 1.44 |
| 2009 | 59,095,000 | 568,857 | 591,663 | -22,806 | 9.6 | 9.8 | -0.3 | 3.4 | 1.44 |
| 2010 | 59,277,000 | 561,944 | 587,488 | -25,544 | 9.4 | 9.7 | -0.3 | 2.0 | 1.44 |
| 2011 | 59,379,000 | 546,585 | 593,402 | -46,817 | 9.1 | 9.9 | -0.8 | 3.5 | 1.44 |
| 2012 | 59,540,000 | 534,186 | 612,883 | -78,697 | 8.9 | 10.2 | -1.3 | 13.0 | 1.42 |
| 2013 | 60,234,000 | 514,308 | 600,744 | -86,436 | 8.5 | 10.0 | -1.4 | 10.6 | 1.39 |
| 2014 | 60,789,000 | 502,596 | 598,364 | -95,768 | 8.3 | 9.9 | -1.6 | 1.7 | 1.38 |
| 2015 | 60,796,000 | 485,780 | 647,571 | -161,791 | 8.1 | 10.7 | -2.7 | 0.6 | 1.36 |
| 2016 | 60,666,000 | 473,438 | 615,261 | -141,823 | 7.9 | 10.2 | -2.4 | 1.0 | 1.36 |
| 2017 | 60,579,000 | 458,151 | 649,061 | -190,910 | 7.6 | 10.8 | -3.2 | 1.6 | 1.34 |
| 2018 | 60,484,000 | 439,747 | 633,133 | -193,386 | 7.3 | 10.6 | -3.2 | -7.8 | 1.31 |
| 2019 | 59,816,673 | 420,084 | 634,417 | -214,333 | 7.0 | 10.6 | -3.6 | 0.7 | 1.27 |
| 2020 | 59,641,488 | 404,892 | 740,317 | -335,425 | 6.8 | 12.4 | -5.6 | -1.2 | 1.24 |
| 2021 | 59,236,213 | 400,249 | 701,346 | -301,097 | 6.8 | 11.8 | -5.2 | 1.7 | 1.25 |
| 2022 | 59,030,133 | 393,333 | 715,077 | -321,744 | 6.8 | 12.1 | -5.4 | 4.8 | 1.24 |
| 2023 | 58,997,201 | 379,890 | 671,065 | -291,175 | 6.4 | 11.2 | -4.8 | 4.7 | 1.20 |
| 2024 | 58,971,230 | 369,944 | 653,109 | -283,165 | 6.3 | 10.8 | -4.5 | 4.1 | 1.18 |
| 2025 | 58,943,464 | 355,435 | 651,830 | -296,395 | 6.0 | 11.1 | -5.1 | 5.0 | 1.14(e) |
| 2026 | 58,942,828 |
In the year 2024, 80,761 babies were born to at least one foreign parent which makes up 21.83 percent of all newborns in that year (20,336 or 5.50 percent were born to foreign mothers, 9,832 or 2.66 percent to foreign fathers, and 50,593 or 13.68 percent to two foreign parents). In Southern Italy (including Sicily and Sardinia) only 9.47 percent of all newborns had 1 or 2 foreign parents, while in Central and Northern Italy their share reached 23.98 and 30.55 percent, respectively.
Current vital statistics
| Period | Live births | Deaths | Natural change |
|---|---|---|---|
| January—December 2024 | 369,944 | 653,109 | –283,165 |
| January—December 2025 | 355,435 | 651,830 | –296,395 |
| Difference | –14,509 (-3.92%) | –1,279 (-0.20%) | –13,230 |
| Source: |
Total fertility rates by region
Total fertility rate (TFR) in Italy by region as of 2024:
| Region | TFR |
|---|---|
| Trentino-Alto Adige | 1.39 |
| Sicily | 1.27 |
| Campania | 1.26 |
| Calabria | 1.25 |
| Veneto | 1.20 |
| Emilia-Romagna | 1.19 |
| Lombardy | 1.19 |
| Friuli-Venezia Giulia | 1.19 |
| Italy | 1.18 |
| Apulia | 1.16 |
| Liguria | 1.16 |
| Piedmont | 1.14 |
| Abruzzo | 1.12 |
| Tuscany | 1.12 |
| Lazio | 1.12 |
| Marche | 1.11 |
| Umbria | 1.11 |
| Basilicata | 1.09 |
| Aosta Valley | 1.05 |
| Molise | 1.04 |
| Sardinia | 0.91 |
Total fertility rates by province
Structure of the population
| Age group | Male | Female | Total | % |
|---|---|---|---|---|
| Total | 28 866 226 | 30 369 987 | 59 236 213 | 100 |
| 0–4 | 1 138 845 | 1 077 665 | 2 216 510 | 3.74 |
| 5–9 | 1 326 061 | 1 252 279 | 2 578 340 | 4.35 |
| 10–14 | 1 463 873 | 1 377 822 | 2 841 695 | 4.80 |
| 15–19 | 1 476 815 | 1 380 198 | 2 857 013 | 4.82 |
| 20–24 | 1 549 500 | 1 407 840 | 2 957 340 | 4.99 |
| 25–29 | 1 566 265 | 1 479 314 | 3 045 579 | 5.14 |
| 30–34 | 1 633 887 | 1 592 259 | 3 226 146 | 5.45 |
| 35–39 | 1 747 529 | 1 735 723 | 3 483 252 | 5.88 |
| 40–44 | 2 001 502 | 2 007 068 | 4 008 570 | 6.77 |
| 45–49 | 2 329 457 | 2 363 044 | 4 692 501 | 7.92 |
| 50–54 | 2 377 041 | 2 440 634 | 4 817 675 | 8.13 |
| 55–59 | 2 261 108 | 2 362 857 | 4 623 965 | 7.81 |
| 60–64 | 1 901 209 | 2 044 887 | 3 946 096 | 6.66 |
| 65–69 | 1 652 948 | 1 821 385 | 3 474 333 | 5.87 |
| 70–74 | 1 609 510 | 1 831 661 | 3 441 171 | 5.81 |
| 75–79 | 1 140 634 | 1 406 576 | 2 547 210 | 4.30 |
| 80–84 | 953 118 | 1 324 845 | 2 277 963 | 3.85 |
| 85–89 | 513 213 | 882 889 | 1 396 102 | 2.36 |
| 90–94 | 186 194 | 443 464 | 629 658 | 1.06 |
| 95–99 | 34 670 | 123 247 | 157 917 | 0.27 |
| 100–104 | 2 728 | 13 404 | 16 132 | 0.03 |
| 105–109 | 117 | 907 | 1 024 | <0.01 |
| 110+ | 2 | 19 | 21 | <0.01 |
| Age group | Male | Female | Total | Percent |
| 0–14 | 3 928 779 | 3 707 766 | 7 636 545 | 12.89 |
| 15–64 | 18 844 313 | 18 813 824 | 37 658 137 | 63.57 |
| 65+ | 6 093 134 | 7 848 397 | 13 941 531 | 23.54 |
Health
Obesity – adult prevalence rate
19.9% (2016) Country comparison to the world: 108
Employment and income
Unemployment, youth ages 15–24:
total: 32.2%. Country comparison to the world: 26th
male: 30.4%
female: 34.8% (2018 est.)
Immigration
The increase in foreign national arrivals in 2023-24 compared to 2022 is seen in almost all areas of origin, with the exception of Europe (-6%), with a more marked decline among European Union countries (-12.6%). The most significant increases concern flows from Africa (+43.9%), followed by America and Oceania (+18.5% overall) and Asia (+12.5%).
Since the fall of the Berlin Wall in 1989, and more recently, the 2004 and 2007 enlargements of the European Union, Italy received growing flows of migrants from the former socialist countries of Eastern Europe (especially Romania, Albania, Ukraine and Poland). The second most important area of immigration to Italy has always been the neighboring North Africa (especially Morocco, Egypt, Tunisia and Algeria). Furthermore, in recent years, growing migration fluxes from the Far East (notably, China and the Philippines) and Latin America (Ecuador, Peru) have been recorded.
Italy does not collect data on ethnicity or race of the country, but does collect data on nationality of its residents.
In 2021, Istat estimated that 5,171,894 foreign citizens lived in Italy, representing about 8.7% of the total population. These figures do not include naturalized foreign-born residents (121,457 foreigners acquired Italian citizenship in 2021) as well as illegal immigrants, the so-called clandestini, whose numbers, difficult to determine, are thought to be at least 670,000. Romanians made up the largest community in the country (1,145,718; around 10% of them being ethnic Romani people), followed by Albanians (441,027) and Moroccans (422,980).
The fourth largest community of foreign residents in Italy was represented by the Chinese. The majority of Chinese living in Italy are from the city of Wenzhou in the province of Zhejiang. Breaking down the foreign-born population by continent, in 2020 the figures were as follows: Europe (54%), Africa (22%), Asia (16%), the Americas (8%) and Oceania (0.06%). The distribution of immigrants is largely uneven in Italy: 83% of immigrants live in the northern and central parts of the country (the most economically developed areas), while only 17% live in the southern half of the peninsula.
Net migration rate
3.21 migrant(s)/1,000 population (2021 est.) Country comparison to the world: 34th
| Nationality groups | 2002 | 2005 | 2010 | 2015 | 2019 | 2021 | 2023 | 2025 | ||||||||
|---|---|---|---|---|---|---|---|---|---|---|---|---|---|---|---|---|
| Number | % | Number | % | Number | % | Number | % | Number | % | Number | % | Number | % | Number | % | |
| Italy Italians | 55,651,856 | 97.64 | 55,775,350 | 96.09 | 55,853,967 | 93.57 | 55,460,252 | 91.98 | 54,820,515 | 91.65 | 54,064,319 | 91.27 | 53,855,860 | 91.29 | 53,383,937 | 90.57 |
| Foreigners | 1,341,414 | 2.36 | 2,269,018 | 3.91 | 3,836,349 | 6.43 | 4,835,245 | 8.02 | 4,996,158 | 8.35 | 5,171,894 | 8.73 | 5,141,341 | 8.71 | 5,559,527 | 9.43 |
| European Union EU-27 | – | – | – | – | – | – | – | – | 1,472,847 | 2.46% | 1,406,623 | 2.47% | 1,393,782 | 2.36% | ||
| Other European | – | – | – | – | – | – | – | – | 1,036,761 | 1.73% | 1,053,765 | 1.78% | 1,024,029 | 1.74% | ||
| Northern Africa | – | – | – | – | – | – | – | – | 639,994 | 1.07% | 689,649 | 1.16% | 689,083 | 1.17% | ||
| Central and South Asia | – | – | – | – | – | – | – | – | 528,182 | 0.88% | 605,000 | 1.02% | 619,671 | 1.05% | ||
| Eastern Asia | – | – | – | – | – | – | – | – | 464,557 | 0.78% | 521,686 | 0.88% | 489,804 | 0.83% | ||
| Western Africa | – | – | – | – | – | – | – | – | 389,602 | 0.65% | 400,112 | 0.68% | 401,218 | 0.68% | ||
| Central and South America | – | – | – | – | – | – | – | – | 345,466 | 0.58% | 366,062 | 0.62% | 370,415 | 0.63% | ||
| Western Asia | – | – | – | – | – | – | – | – | 36,914 | – | 44,272 | – | 71,761 | – | ||
| Eastern Africa | – | – | – | – | – | – | – | – | 37,131 | – | 35,486 | – | 35,833 | – | ||
| Central and South Africa | – | – | – | – | – | – | – | – | 24,919 | – | 25,343 | – | 25,299 | – | ||
| Northern America | – | – | – | – | – | – | – | – | 17,082 | – | 21,216 | – | 17,812 | – | ||
| Oceania | – | – | – | – | – | – | – | – | 2,120 | – | 2,248 | – | 1,991 | – | ||
| Stateless | – | – | – | – | – | – | – | – | 583 | – | 432 | – | 643 | – | ||
| Total | 56,993,270 | 100 | 58,044,368 | 100 | 59,690,316 | 100 | 60,295,497 | 100 | 59,816,673 | 100 | 59,236,213 | 100 | 58,997,201 | 100 | 58,943,464 | 100 |

| Year | Population | Ref. |
|---|---|---|
| 2002 | 1,341,209 | |
| 2003 | 1,464,663 | |
| 2004 | 1,854,748 | |
| 2005 | 2,210,478 | |
| 2006 | 2,419,483 | |
| 2007 | 2,592,950 | |
| 2008 | 3,023,317 | |
| 2009 | 3,402,435 | |
| 2010 | 3,648,128 | |
| 2011 | 3,879,224 | |
| 2012 | 4,052,081 | |
| 2013 | 4,387,721 | |
| 2014 | 4,922,085 | |
| 2015 | 5,014,437 | |
| 2016 | 5,026,153 | |
| 2017 | 5,047,028 | |
| 2018 | 5,144,440 | |
| 2019 | 5,255,503 | |
| 2020 | 5,171,894 | |
| 2021 | 5,030,716 | |
| 2022 | 5,141,341 | |
| 2023 | 5,253,658 | |
| 2024 | 5,371,251 |
There are, as of 2022, 5,030,716 Foreign-born residents, accounting for 8.5% of the total population.
Their distribution by country of origin was as follows:
| Country | Population |
|---|---|
| European UnionRomania | 1,053,042 |
| Albania | 414,622 |
| Morocco | 412,457 |
| China | 311,250 |
| Ukraine | 287,187 |
| Bangladesh | 213,622 |
| India | 171,429 |
| Philippines | 153,455 |
| Egypt | 174,141 |
| Pakistan | 171,179 |
| Nigeria | 132,129 |
| Senegal | 119,067 |
| Sri Lanka | 113,705 |
| Moldova | 94,141 |
| Tunisia | 123,828 |
| Peru | 116,169 |
| European UnionPoland | 72,212 |
| Ecuador | 57,980 |
| Brazil | 54,338 |
| North Macedonia | 47,372 |
| European UnionBulgaria | 47,465 |
| Ghana | 46,327 |
| Russia | 43,119 |
| Kosovo | 36,180 |
| European UnionGermany | 36,427 |
| Serbia | 28,426 |
| European UnionFrance | 31,956 |
| Dominican Republic | 30,200 |
| Georgia | 36,490 |
| Ivory Coast | 35,436 |
| European UnionSpain | 30,074 |
| United Kingdom | 25,745 |
| Cuba | 26,476 |
| El Salvador | 25,880 |
| Gambia | 28,598 |
| Mali | 27,214 |
| Colombia | 26,395 |
| Bosnia and Herzegovina | 18,600 |
Italy migration data
| Year | Emigration | Immigration | Net Migration |
|---|---|---|---|
| 1971 | 167,721 | 128,572 | -39,149 |
| 1972 | 141,852 | 138,246 | -3,606 |
| 1973 | 123,802 | 125,168 | 1,366 |
| 1974 | 112,020 | 116,708 | 4,688 |
| 1975 | 92,666 | 122,774 | 30,108 |
| 1976 | 97,247 | 115,997 | 18,750 |
| 1977 | 87,655 | 101,985 | 14,330 |
| 1978 | 85,550 | 89,897 | 4,347 |
| 1979 | 88,950 | 91,693 | 2,743 |
| 1980 | 84,877 | 90,463 | 5,586 |
| 1981 | 89,221 | 88,886 | -335 |
| 1982 | 98,241 | 92,423 | -5,818 |
| 1983 | 85,138 | 87,804 | 2,666 |
| 1984 | 77,318 | 77,002 | -316 |
| 1985 | 66,737 | 67,277 | 540 |
| 1986 | 57,862 | 56,006 | -1,856 |
| 1987 | 38,305 | 57,665 | 19,360 |
| 1988 | 36,660 | 52,562 | 15,902 |
| 1989 | 59,894 | 53,893 | -6,001 |
| 1990 | 48,916 | 70,035 | 21,119 |
| 1991 | 51,478 | 56,004 | 4,526 |
| 1992 | 50,226 | 54,849 | 4,623 |
| 1993 | 54,980 | 49,261 | -5,719 |
| 1994 | 59,402 | 46,761 | -12,641 |
| 1995 | 34,886 | 28,472 | -6,414 |
| 1996 | 39,017 | 28,816 | -10,201 |
| 1997 | 38,984 | 30,352 | -8,632 |
| 1998 | 38,148 | 29,946 | -8,202 |
| 1999 | 56,283 | 32,152 | -24,131 |
| 2000 | 47,480 | 34,411 | -13,069 |
| 2001 | 46,901 | 35,416 | -11,485 |
| 2002 | 34,056 | 44,476 | 10,420 |
| 2003 | 39,866 | 47,530 | 7,664 |
| 2004 | 39,155 | 41,794 | 2,639 |
| 2005 | 41,991 | 37,326 | -4,665 |
| 2006 | 46,308 | 37,666 | -8,642 |
| 2007 | 36,299 | 36,693 | 394 |
| 2008 | 39,536 | 32,118 | -7,418 |
| 2009 | 39,024 | 29,330 | -9,694 |
| 2010 | 39,545 | 28,192 | -11,353 |
| 2011 | 50,057 | 31,466 | -18,591 |
| 2012 | 67,998 | 29,467 | -38,531 |
| 2013 | 82,095 | 28,433 | -53,662 |
| 2014 | 88,859 | 29,271 | -59,588 |
| Year | Immigration | Emigration | Net Migration |
|---|---|---|---|
| 2002 | 213,202 | 41,756 | 171,446 |
| 2003 | 440,301 | 48,706 | 391,595 |
| 2004 | 414,880 | 49,910 | 364,970 |
| 2005 | 304,960 | 53,931 | 251,029 |
| 2006 | 279,714 | 58,407 | 221,307 |
| 2007 | 527,123 | 51,113 | 476,010 |
| 2008 | 494,394 | 67,671 | 426,723 |
| 2009 | 421,859 | 64,921 | 356,938 |
| 2010 | 447,744 | 67,501 | 380,243 |
| 2011 | 385,793 | 82,461 | 303,332 |
| 2012 | 350,772 | 106,216 | 244,556 |
| 2013 | 307,454 | 125,735 | 181,719 |
| 2014 | 277,631 | 136,328 | 141,303 |
| 2015 | 280,078 | 146,955 | 133,123 |
| 2016 | 300,823 | 157,065 | 143,758 |
| 2017 | 343,440 | 155,110 | 188,330 |
| 2018 | 332,324 | 159,960 | 172,364 |
| 2019 | 332,778 | 179,505 | 153,273 |
| 2020 | 247,526 | 158,884 | 88,642 |
| 2021 | 318,366 | 158,312 | 160,054 |
| 2022 | 410,985 | 150,189 | 260,796 |
| 2023 | 439,658 | 158,438 | 281,220 |
| 2024 | 451,583 | 188,903 | 262,680 |
| 2025 | 439,916 | 144,157 | 295,759 |
Languages
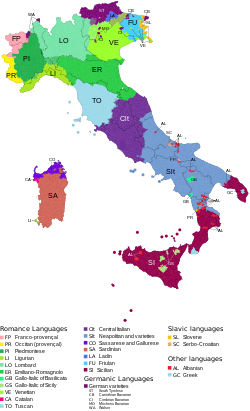
Italy's official language is Italian; Ethnologue has estimated that there are about 55 million speakers of Italian in the country and a further 6.7 million outside of it, primarily in the neighboring countries and in the Italian diaspora worldwide. Italian, adopted by the central state after the unification of Italy, is a language based on the Florentine variety of Tuscan and is somewhat intermediate between the Italo-Dalmatian languages and the Gallo-Romance languages. Its development was also influenced by the Germanic languages of the post-Roman invaders. When Italy unified in 1861, only 3% of the population spoke Italian, even though an estimated 90% of Italians speak Italian as their L1 nowadays.
Italy is in fact one of the most linguistically diverse countries in Europe, as there are not only varieties of Italian specific to each cultural region, but also distinct regional and minority languages. The establishment of the national education system has led to the emergence of the former and a decrease in the use of the latter. The spread of Italian was further expanded in the 1950s and 1960s, because of the economic growth and the rise of mass media and television, with the state broadcaster (RAI) setting a colloquial variety of Italian to which the population would be exposed.
As a way to distance itself from the Italianization policies promoted because of nationalism, Italy recognized twelve languages as the Country's "historical linguistic minorities", which are promoted alongside Italian in their respective territories. French is co-official in the Aosta Valley as the province's prestige variety, under which the more commonly spoken Franco-Provencal dialects have been historically roofed. German has the same status in the province of Bolzano as, in some parts of that province and in parts of the neighbouring Trentino, does Ladin. Slovene and Friulian are officially recognised in the provinces of Trieste, Gorizia and Udine in Venezia Giulia. In Sardinia, the Sardinian language has been the language traditionally spoken and is often regarded by linguists as constituting its own branch of Romance; in the 1990s, Sardinian has been recognized as "having equal dignity" with Italian, the introduction of which to the island officially started under the rule of the House of Savoy in the 18th century.
In these regions, official documents are either bilingual (trilingual in Ladin communities) in the co-official language(s) by default, or available as such upon request. Traffic signs are also multilingual, except in the Valle d'Aosta where French toponyms are generally used, with the exception of Aosta itself, which has retained its Latin form in Italian as well as English. Attempts to Italianize them, especially during the Fascist period, have been formally abandoned. Education is possible in minority languages where such schools are operating. UNESCO and other authorities recognize a number of other languages which are not legally protected by Italian government: Piedmontese, Venetian, Ligurian, Lombard, Emilian-Romagnolo, Neapolitan and Sicilian.
Religion
- Catholicism (79.2%)
- Eastern Orthodoxy (3.50%)
- Protestantism (0.30%)
- Other Christian (1.40%)
- Islam (1.00%)
- Buddhism (0.40%)
- Hinduism (0.30%)
- Judaism (0.10%)
- Other (1.40%)
- Agnosticism (7.50%)
- Atheism (4.10%)
- Undeclared (1.00%)
- Sikhism (0.30%)
Catholicism is by far the largest religion in the country, although the Catholic Church is no longer officially the state religion. In 2006, 87.8% of Italy's population self-identified as Catholic, although only about one-third of these described themselves as active members (36.8%). In 2016, 71.1% of Italian citizens self-identified as Catholic. This increased again to 78% in 2018.
Most Italians believe in God, or a form of a spiritual life force. According to a Eurobarometer Poll in 2005: 74% of Italian citizens responded that 'they believe there is a God', 16% answered that 'they believe there is some sort of spirit or life force' and 6% answered that 'they do not believe there is any sort of spirit, God, or life force'. There are no data collected through census.
Christianity
The Italian Catholic Church is part of the global Catholic Church, under the leadership of the Pope, curia in Rome, and the Conference of Italian Bishops. In addition to Italy, two other sovereign nations are included in Italian-based dioceses, San Marino and Vatican City. There are 225 dioceses in the Italian Catholic Church, see further in this article and in the article List of Catholic dioceses in Italy. Even though by law Vatican City is not part of Italy, it is in Rome, and along with Latin, Italian is the most spoken and second language of the Roman Curia.
Italy has a rich Catholic culture, especially as numerous Catholic saints, martyrs and popes were Italian themselves. Catholic art in Italy especially flourished during the Middle Ages, Renaissance and Baroque periods, with numerous Italian artists, such as Michelangelo, Leonardo da Vinci, Raphael, Caravaggio, Fra Angelico, Gian Lorenzo Bernini, Sandro Botticelli, Tintoretto, Titian and Giotto. Catholic architecture in Italy is equally as rich and impressive, with churches, basilicas and cathedrals such as St Peter's Basilica, Florence Cathedral and St Mark's Basilica. Catholicism is the largest religion and Christian denomination in Italy, with around 71.1% of Italians considering themselves Catholic. Italy is also home to the greatest number of cardinals in the world, and is the country with the greatest number of Catholic churches per capita.

Even though the main Christian denomination in Italy is Catholicism, there are some minorities of Protestant, Waldensian, Eastern Orthodox and other Christian churches.
Immigration from Western, Central, and Eastern Africa at the beginning of the 21st century has increased the size of Baptist, Anglican, Pentecostal and Evangelical communities in Italy, while immigration from Eastern Europe has produced large Eastern Orthodox communities.
In 2006, Protestants made up 2.1% of Italy's population, and members of Eastern Orthodox churches comprised 1.2% or more than 700,000 Eastern Orthodox Christians including 180,000 Greek Orthodox, 550,000 Pentecostals and Evangelists (0.8%), of whom 400,000 are members of the Assemblies of God, about 250,000 are Jehovah's Witnesses (0.4%), 30,000 Waldensians, 25,000 Seventh-day Adventists, 22,000 Mormons, 15,000 Baptists (plus some 5,000 Free Baptists), 7,000 Lutherans, 4,000 Methodists (affiliated with the Waldensian Church).
Other religions
The longest-established religious faith in Italy is Judaism, Jews having been present in Ancient Rome before the birth of Christ. Italy has seen many influential Italian-Jews, such as prime minister Luigi Luzzatti, who took office in 1910, Ernesto Nathan served as mayor of Rome from 1907 to 1913 and Shabbethai Donnolo (died 982). During the Holocaust, Italy took in many Jewish refugees from Nazi Germany. However, with the creation of the Nazi-backed puppet Italian Social Republic, about 15% of 48,000 Italian Jews were killed. This, together with the emigration that preceded and followed the Second World War, has left only a small community of around 45,000 Jews in Italy today.
Due to immigration from around the world, there has been an increase in non-Christian religions. As of 2009, there were 1.0 million Muslims in Italy forming 1.6 percent of population; independent estimates put the Islamic population in Italy anywhere from 0.8 million to 1.5 million. 50,000 Italian Muslims hold Italian citizenship.
There are more than 200,000 followers of faiths originating in the Indian subcontinent, including some 70,000 Sikhs with 22 gurdwaras across the country, 70,000 Hindus, and 50,000 Buddhists. There were an estimated 4,900 Bahá'ís in Italy in 2005.
Education
Literacy (defined as: ages 15 and over can read and write)
total population: 99.2%
male: 99.4%
female: 99% (2018 est.)
School life expectancy (primary to tertiary education)
total: 16 years
male: 16 years
female: 17 years (2018)
Genetics and ethnic groups

The genetic history of Italy is greatly influenced by geography and history. The ancestors of Italians are mostly Indo-European speakers (Italic peoples such as Latins, Umbrians, Samnites, Oscans, Sicels and Adriatic Veneti, as well as Celts, Iapygians and Greeks) and pre-Indo-European speakers (Etruscans, Ligures, Rhaetians and Camunni in mainland Italy, Sicani and Elymians in Sicily and the Nuragic people in Sardinia). During the imperial period of Ancient Rome, the city of Rome hosted a diverse population from across Europe and the Mediterranean. Based on DNA analysis, there is evidence of ancient regional genetic substructure and continuity within modern Italy dating to the pre-Roman and Roman periods.
The Italian population is marked by considerable cultural, linguistic, genetic and historical diversity which results in the presence of several distinct groups throughout the peninsula. In this regard, peoples like the Friulians, the Ladins, the Sardinians and the Tyrolese, who are recognized linguistic minorities, or even the Sicilians who are not, serve as cases in point attesting to such internal diversity.
Linguistic minorities in Italy include Sardu-speakers 1 million, Tyrolese German-speakers 350,000, Albanians 70,000 – 100,000, Slovenes 60,000, Franco-Provençal-speakers 50,000 – 70,000, Occitans 20,000 – 40,000, Ladins 30,000, Catalans 15,000, Greek-speakers 12,000, Croatians 3,000 and Friulians 600,000. The Roma community is one of the largest ethnic minorities in Italy. Due to the lack of disaggregated data the size of the Italian Roma community remains unknown. The Council of Europe estimates that between 120,000 and 180,000 Roma live in Italy. A significant proportion of Roma in Italy do not have Italian citizenship.
See also
- List of Italians
- Italian diaspora
- Italian Americans
- Italian Brazilians
- Italian Argentines
- Italian Venezuelans
- Romani people in Italy
Notes
External links
- 22 June 2017 at the Wayback Machine
- Allianz Knowledge