Biomass (ecology)
In-game article clicks load inline without leaving the challenge.

Biomass is the total mass of living biological organisms in a given area or ecosystem at a specific time. Biomass may refer to the species biomass, which is the mass of one or more species, or to community biomass, which is the mass of all species in the community. It encompasses microorganisms, plants, and animals, and is typically expressed as total mass or average mass per unit area.
The method used to measure biomass depends on the context. In some cases, biomass refers to the wet weight of organisms as they exist in nature. For example, in a salmon fishery, the salmon biomass might be regarded as the total wet weight the salmon would have if they were taken out of the water. In other contexts, biomass can be measured in terms of the dried organic mass, so perhaps only 30% of the actual weight might count, the rest being water. In other contexts, it may refer to dry weight (excluding water content), or to the mass of organic carbon, excluding inorganic components such as bones, shells, or teeth.
In 2018, Bar-On et al. estimated Earth's total live biomass at approximately 550 billion tonnes of carbon, the majority of which is found in plants. A 1998 study by Field et al. estimated global annual net primary production at just over 100 billion tonnes of carbon per year. While bacteria were once believed to account for a biomass comparable to that of plants, more recent research indicates they represent a much smaller proportion. The total number of DNA base pairs on Earth – sometimes used as a possible approximation of global biodiversity – has been estimated at (5.3±3.6)×1037, with a mass of around 50 billion tonnes. By the year 2020, the mass of human-made materials or anthropogenic mass, defined as "the mass embedded in inanimate solid objects made by humans (that have not yet been demolished or taken out of service)", was projected to surpass that of all living biomass on Earth.
Ecological pyramids

An ecological pyramid is a graphical representation that shows, for a given ecosystem, the relationship between biomass or biological productivity and trophic levels.
- A biomass pyramid shows the amount of biomass at each trophic level.
- A productivity pyramid shows the production or turn-over in biomass at each trophic level.
An ecological pyramid provides a snapshot in time of an ecological community.
The bottom of the pyramid represents the primary producers (autotrophs). The primary producers take energy from the environment in the form of sunlight or inorganic chemicals and use it to create energy-rich molecules such as carbohydrates. This mechanism is called primary production. The pyramid then proceeds through the various trophic levels to the apex predators at the top.
When energy is transferred from one trophic level to the next, typically only ten percent is used to build new biomass. The remaining ninety percent goes to metabolic processes or is dissipated as heat. This energy loss means that productivity pyramids are never inverted, and generally limits food chains to about six levels. However, in oceans, biomass pyramids can be wholly or partially inverted, with more biomass at higher levels.
Terrestrial biomass

Terrestrial biomass generally decreases markedly at each higher trophic level (plants, herbivores, carnivores). Examples of terrestrial producers are grasses, trees and shrubs. These have a much higher biomass than the animals that consume them, such as deer, zebras and insects. The level with the least biomass are the highest predators in the food chain, such as foxes and eagles.
In a temperate grassland, grasses and other plants are the primary producers at the bottom of the pyramid. Then come the primary consumers, such as grasshoppers, voles and bison, followed by the secondary consumers, shrews, hawks and small cats. Finally the tertiary consumers, large cats and wolves. The biomass pyramid decreases markedly at each higher level.
Changes in plant species in the terrestrial ecosystem can result in changes in the biomass of soil decomposer communities. Biomass in C3 and C4 plant species can change in response to altered concentrations of CO2. C3 plant species have been observed to increase in biomass in response to increasing concentrations of CO2 of up to 900 ppm.
Ocean biomass
Ocean or marine biomass, in a reversal of terrestrial biomass, can increase at higher trophic levels. In the ocean, the food chain typically starts with phytoplankton, and follows the course:
Phytoplankton → zooplankton → predatory zooplankton → filter feeders → predatory fish

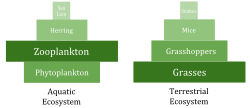
Phytoplankton are the main primary producers at the bottom of the marine food chain. Phytoplankton use photosynthesis to convert inorganic carbon into protoplasm. They are then consumed by zooplankton that range in size from a few micrometers in diameter in the case of protistan microzooplankton to macroscopic gelatinous and crustacean zooplankton.
Zooplankton comprise the second level in the food chain, and includes small crustaceans, such as copepods and krill, and the larva of fish, squid, lobsters and crabs.
In turn, small zooplankton are consumed by both larger predatory zooplankters, such as krill, and by forage fish, which are small, schooling, filter-feeding fish. This makes up the third level in the food chain.
A fourth trophic level can consist of predatory fish, marine mammals and seabirds that consume forage fish. Examples are swordfish, seals and gannets.
Apex predators, such as orcas, which can consume seals, and shortfin mako sharks, which can consume swordfish, make up a fifth trophic level. Baleen whales can consume zooplankton and krill directly, leading to a food chain with only three or four trophic levels.
Marine environments can have inverted biomass pyramids. In particular, the biomass of consumers (copepods, krill, shrimp, forage fish) is larger than the biomass of primary producers. This happens because the ocean's primary producers are tiny phytoplankton which are r-strategists that grow and reproduce rapidly, so a small mass can have a fast rate of primary production. In contrast, terrestrial primary producers, such as forests, are K-strategists that grow and reproduce slowly, so a much larger mass is needed to achieve the same rate of primary production.
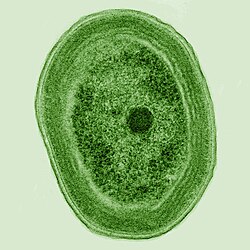
Among the phytoplankton at the base of the marine food web are members from a phylum of bacteria called cyanobacteria. Marine cyanobacteria include the smallest known photosynthetic organisms. The smallest of all, Prochlorococcus, is approximately 0.5 to 0.8 micrometres across. In terms of individual numbers, Prochlorococcus is possibly the most plentiful species on Earth: a single millilitre of surface seawater can contain 100,000 cells or more. Worldwide, there are estimated to be several octillion (1027) individuals. Prochlorococcus is ubiquitous between 40°N and 40°S and dominates in the oligotrophic (nutrient poor) regions of the oceans. The bacterium accounts for an estimated 20% of the oxygen in the Earth's atmosphere, and forms part of the base of the ocean food chain.
Bacterial biomass
Bacteria and archaea are both classified as prokaryotes, and their biomass is commonly estimated together. The global biomass of prokaryotes is estimated at 30 billion tonnes C, dominated by bacteria.
| Geographic location | Number of cells (× 1029) | Billion tonnes of carbon |
|---|---|---|
| Open ocean | 1.2 | 1.6 to 2.2 |
| Ocean subsurface | 5 | 10 |
| Terrestrial soil | 3 | 8 |
| Terrestrial subsurface | 2 to 6 | 4 to 12 |
| Total | 11 to 15 | 23 to 31 |
The estimates for the global biomass of prokaryotes had changed significantly over recent decades, as more data became available. A much-cited study from 1998 collected data on abundances (number of cells) of bacteria and archaea in different natural environments, and estimated their total biomass at 350 to 550 billion tonnes C. This vast amount is similar to the biomass of carbon in all plants. The vast majority of bacteria and archaea were estimated to be in sediments deep below the seafloor or in the deep terrestrial biosphere (in deep continental aquifers). However, updated measurements reported in a 2012 study reduced the calculated prokaryotic biomass in deep subseafloor sediments from the original ≈300 billion tonnes C to ≈4 billion tonnes C (range 1.5–22 billion tonnes). This update originates from much lower estimates of both the prokaryotic abundance and their average weight.
A census published in PNAS in May 2018 estimated global bacterial biomass at ≈70 billion tonnes C, of which ≈60 billion tonnes are in the terrestrial deep subsurface. It also estimated the global biomass of archaea at ≈7 billion tonnes C. A later study by the Deep Carbon Observatory published in 2018 reported a much larger dataset of measurements, and updated the total biomass estimate in the deep terrestrial biosphere. It used this new knowledge and previous estimates to update the global biomass of bacteria and archaea to 23–31 billion tonnes C. Roughly 70% of the global biomass was estimated to be found in the deep subsurface. The estimated number of prokaryotic cells globally was estimated to be 11–15 × 1029. With this information, the authors of the May 2018 PNAS article revised their estimate for the global biomass of prokaryotes to ≈30 billion tonnes C, similar to the Deep Carbon Observatory estimate.
These estimates convert global abundance of prokaryotes into global biomass using average cellular biomass figures that are based on limited data. Recent estimates used an average cellular biomass of about 20–30 femtogram carbon (fgC) per cell in the subsurface and terrestrial habitats.
Global biomass
The total global biomass has been estimated at 550 billion tonnes C. A breakdown of the global biomass is given by kingdom in the table below, based on a 2018 study by Bar-On et. al.
| Kingdom | Global biomass in billion tonnes of carbon | Global dry biomass in billion tonnes | Global wet biomass in billion tonnes | Image |
|---|---|---|---|---|
| Plantae | 450 | 900 | 2700 | |
| Bacteria + Archaea | 30 | 60 | 200 | |
| Fungi | 12 | 24 | 80 | |
| Protista | 4 | 8 | 25 | |
| Animalia | 2 | 4 | 13 | |
| Total | 500 | 1000 | 3000 |

Animals represent less than 0.5% of the total biomass on Earth, with about 2 billion tonnes C in total. Most animal biomass is found in the oceans, where arthropods, such as copepods, account for about 1 billion tonnes C and fish for another 0.7 billion tonnes C. Roughly half of the biomass of fish in the world are mesopelagic, such as lanternfish, spending most of the day in the deep, dark waters. Marine mammals such as whales and dolphins account for about 0.006 billion tonnes C. Land animals account for about 500 million tonnes C, or about 20% of the biomass of animals on Earth. Terrestrial arthropods account for about 150 million tonnes C, most of which is found in the topsoil. Land mammals account for about 180 million tonnes C, most of which are humans (about 80 million tonnes C) and domesticated mammals (about 90 million tonnes C). Wild terrestrial mammals account for only about 3 million tonnes C, less than 2% of the total mammalian biomass on land.

Most of the global biomass is found on land, with only 5 to 10 billion tonnes C found in the oceans. On land, there is about 1,000 times more plant biomass (phytomass) than animal biomass (zoomass). About 18% of this plant biomass is eaten by the land animals. However, marine animals eat most of the marine autotrophs, and the biomass of marine animals is greater than that of marine autotrophs.
According to a 2020 study published in Nature, human-made materials, or technomass, outweigh all living biomass on earth, with plastic alone exceeding the mass of all land and marine animals combined.
| name | number of species | date of estimate | individual count | mean living mass of individual | percent biomass (dried) | global dry biomass in million tonnes | global wet (fresh) biomass in million tonnes | |
|---|---|---|---|---|---|---|---|---|
| Terrestrial | Humans | 1 | November 2022 | 8 billion | 50 kg (incl children) | 40% | 160 | 400 |
| 2005 | 4.63 billion adults | 62 kg (excl. children) | 287 | |||||
| Cattle | 1 | 2021 | 1.5 billion | 300 kg | 30% | 125 | 416 | |
| Sheep | 1 | 2021 | 1.3 billion | 30 kg | 30% | 12 | 39 | |
| Goats | 1 | 2021 | 1.1 billion | 30 kg | 30% | 10 | 32 | |
| Chickens | 1 | 2021 | 26 billion | 0.9 kg for broilers, 1.8 kg for layers | 30% | 8 | 25 | |
| Ants | 15,700 | 2022 | 20–90×1015 | 3.7 mg-5.5 mg | 22.8% | 10–100 | 40–450 | |
| Earthworms | 7,000–30,000 | 2016 | 10 mg (dry weight) | 10–25% | 400 | 1,600 | ||
| Termites | 2,972[citation needed] | 2022 | 2 mg | 27% | 100 | 440 | ||
| Nematodes | 2019 | 4.4×10²⁰ | 20% | 60 | 300 | |||
| Marine | Blue whales | 1 | Pre-whaling | 340,000 | 40% | 36 | ||
| 2023 | 50,000 | 60,000 kg | 40% | 1.2 | 3 | |||
| Fish | >20,000 | 2022 | 30% | 3,000 | 9,000 | |||
| Antarctic krill | 1 | 2008 | 7.8×10¹⁴ | 0.486 g | 379 (in peak season) | |||
| Copepods (a zooplankton) | 13,000 | 10−6–10−9 kg | ||||||
| Cyanobacteria (a picoplankton) | ? | 2003 | 1,000 |
Global rate of production

Net primary production is the rate at which new biomass is generated, mainly due to photosynthesis. Global primary production can be estimated from satellite observations. Satellites scan the normalised difference vegetation index (NDVI) over terrestrial habitats and scan sea-surface chlorophyll levels over oceans. This results in 56.4 billion tonnes C/yr (53.8%) for terrestrial primary production and 48.5 billion tonnes C/yr for oceanic primary production. Thus, the total photoautotrophic primary production for the Earth is about 104.9 billion tonnes C/yr. This translates to about 426 gC/m2/yr for land production (excluding areas with permanent ice cover) and 140 gC/m2/yr for the oceans.
However, there is a much more significant difference in standing stocks—while accounting for almost half of the total annual production, oceanic autotrophs account for only about 0.2% of the total biomass.
Terrestrial freshwater ecosystems generate about 1.5% of the global net primary production.
Some global producers of biomass, in order of productivity rates, are
| Producer | Biomass productivity (gC/m2/yr) | Ref | Total area (million km2) | Ref | Total production (billion tonnes C/yr) |
|---|---|---|---|---|---|
| Swamps and marshes | 2,500 | 5.7 | |||
| Tropical rainforests | 2,000 | 8 | 16 | ||
| Coral reefs | 2,000 | 0.28 | 0.56 | ||
| Algal beds | 2,000 | ||||
| River estuaries | 1,800 | ||||
| Temperate forests | 1,250 | 19 | 24 | ||
| Cultivated lands | 650 | 17 | 11 | ||
| Tundras | 140 | 11.5–29.8 | |||
| Open ocean | 125 | 311 | 39 | ||
| Deserts | 3 | 50 | 0.15 |
See also
- Biomass – Biological material from living or recently living organisms
- Biomass (energy) – Biological material used as a renewable energy source
- Biomass partitioning
- Organic matter – Matter composed of organic compounds
- Productivity (ecology) – Rate of generation of biomass in an ecosystem
- Primary nutritional groups – Group of organisms
- Standing stock – Measurement of population size per unit area or unit volume
- Slash-and-burn
- Stubble burning
- Lake Pohjalampi – Lake in Finland - a biomass manipulation study
- List of commercially important fish species – Aquatic animals that are harvested commercially in the greatest amounts
Further reading
- Foley JA, Monfreda C, Ramankutty N, Zaks D (July 2007). . Proceedings of the National Academy of Sciences of the United States of America. 104 (31): 12585–12586. Bibcode:. doi:. PMC . PMID .
- Haberl H, Erb KH, Krausmann F, Gaube V, Bondeau A, Plutzar C, Gingrich S, Lucht W, Fischer-Kowalski M (July 2007). . Proceedings of the National Academy of Sciences of the United States of America. 104 (31): 12942–12947. Bibcode:. doi:. PMC . PMID .
- Purves WK, Orians GH (2007). Life: The Science of Biology (8th ed.). W. H. Freeman. ISBN 978-1-4292-0877-2.
External links
- 12 December 2013 at the Wayback Machine