Los Angeles County, California
In-game article clicks load inline without leaving the challenge.
Los Angeles County, sometimes abbreviated as LA County, is a county in the U.S. state of California, in the southern region of the state. It is the most populous county in the United States, with 9,694,934 residents estimated in 2025. Its population is greater than that of 40 individual U.S. states. Comprising 88 incorporated cities and 101 unincorporated areas within a total area of 4,083 square miles (10,570km2), it accommodates more than a quarter of Californians and is one of the most ethnically diverse U.S. counties. The county's seat, Los Angeles, is the second-most populous city in the United States, with 3,878,704 residents estimated in 2024. The county is globally known as the home of the U.S. motion picture industry since its inception in the early 20th century.
History

The County of Los Angeles is one of the original counties of California, created at the time of statehood in 1850. The county originally included parts of what are now Kern, San Bernardino, Riverside, Inyo, Tulare, Ventura, and Orange counties. In 1851 and 1852, Los Angeles County stretched from the coast to the state line of Nevada. As the population increased, sections were split off to organize San Bernardino County in 1853, Kern County in 1866, and Orange County in 1889.
Before the 1870s, Los Angeles County was divided into townships (many of which were amalgamations of one or more old ranchos):
- Azusa – encompassed the foothill communities east of the San Gabriel River, including present-day Covina and Duarte
- El Monte – encompassed communities in the Whittier Narrows area, including present-day El Monte, La Puente, as well as Monterey Park Azusa and El Monte Townships – merged for the 1870 census
- City of Los Angeles – then consisting solely of its four-league Spanish land grant
- Los Angeles Township – consisted of areas surrounding the City of Los Angeles, including the San Fernando Valley and present-day West Los Angeles and East Los Angeles. Most of this area has now been annexed to the city of Los Angeles.
- Los Nietos – consisted of areas south of the Whittier Narrows and Puente Hills south to present-day Long Beach, centered on the early settlement at Los Nietos. Some of this area is now in Orange County
- San Jose – consisted of the eastern portions of the county drained by San Jose Creek, including what is now the cities of Pomona, Claremont and Walnut
- San Gabriel – consisted of the western San Gabriel Valley and foothill communities, including present-day Alhambra and Pasadena. Centered on the Mission San Gabriel
- Santa Ana – consisted of what is now northern and central Orange County, including what is now Fullerton, Huntington Beach and the City of Orange. (Centered on Santa Ana). For the 1870 census, Anaheim district was enumerated separately
- San Juan – consisted of what is now southern Orange County. Centered on Mission San Juan Capistrano
- San Pedro – consisted of the present-day South Bay communities, Compton and western Long Beach. Centered on the wharf of San Pedro. (Renamed Wilmington Township by 1870).
- Tejon – consisted of all of northern Los Angeles County and what is now southern Kern County. Centered on Fort Tejon When Kern County was formed, the portion of the township remaining in Los Angeles County became Soledad Township.
Geography

According to the U.S. Census Bureau, the county has an area of 4,751 square miles (12,310km2), of which 4,058 square miles (10,510km2) (85%) is land and 693 square miles (1,790km2) (15%) is water. Los Angeles County borders 70 miles (110km) of coast on the Pacific Ocean and encompasses mountain ranges, valleys, forests, islands, lakes, rivers, and desert. The Los Angeles River, Rio Hondo, Ballona Creek, the San Gabriel River and the Santa Clara River flow in Los Angeles County, while the primary mountain ranges are the Santa Monica Mountains and the San Gabriel Mountains. The western extent of the Mojave Desert begins in the Antelope Valley, in the northeastern part of the county. Los Angeles County is bordered on the north by Kern County, on the east by San Bernardino County, on the southeast by Orange County, on the south by the Pacific Ocean, and on the west by Ventura County.
Most of the population of Los Angeles County resides in the south and southwest, with major population centers in the Los Angeles Basin, San Fernando Valley, and San Gabriel Valley. Other population centers are found in the Santa Clarita Valley, Pomona Valley, Crescenta Valley and Antelope Valley.
The county is divided west-to-east by the San Gabriel Mountains, which are part of the Transverse Ranges of southern California, and are contained mostly within the Angeles National Forest. Most of the county's highest peaks are in the San Gabriel Mountains, including Mount San Antonio 10,068 feet (3,069m) at the Los Angeles–San Bernardino county lines, Mount Baden-Powell 9,399 feet (2,865m), Mount Burnham 8,997 feet (2,742m) and Mount Wilson 5,710 feet (1,740m). Several lower mountains are in the northern, western, and southwestern parts of the county, including the San Emigdio Mountains, the southernmost part of Tehachapi Mountains and the Sierra Pelona Mountains.
Los Angeles County includes San Clemente Island and Santa Catalina Island, which are part of the Channel Islands archipelago off the Pacific Coast.
Lakes and reservoirs
- Bouquet Reservoir
- Castaic Lake
- Crystal Lake
- Elizabeth Lake
- Holiday Lake
- Hollywood Reservoir
- Hughes Lake
- Jackson Lake
- Las Virgenes Reservoir
- Malibou Lake
- Morris Reservoir
- Munz Lakes
- Lake Palmdale
- Puddingstone Reservoir
- Pyramid Lake
- Quail Lake
- Silver Lake Reservoir
- Stone Canyon Reservoir
- Tweedy Lake
- Westlake in City of Westlake Village
- Lake Lindero
Major divisions of the county
- East: Eastside, San Gabriel Valley, portions of the Pomona Valley
- West: Westside, Beach Cities
- South: South Bay, South Los Angeles, Palos Verdes Peninsula, Gateway Cities, Los Angeles Harbor Region
- North: San Fernando Valley, Crescenta Valley, portions of the Conejo Valley, portions of the Antelope Valley and Santa Clarita Valley
- Central: Downtown Los Angeles, Mid-Wilshire, Northeast Los Angeles
National protected areas
- Angeles National Forest (part)
- Los Padres National Forest (part)
- Santa Monica Mountains National Recreation Area (part)
Climate
The Northern part of the county has a Desert climate, while the rest of the county generally is a mix of semi-arid and a hot-summer Mediterranean climate. There is rainfall mostly in the wintertime, but the mountains in the north-central part of the county have snow during winter.
Demographics
| Census | Pop. | Note | %± |
|---|---|---|---|
| 1850 | 3,530 | — | |
| 1860 | 11,333 | 221.0% | |
| 1870 | 15,309 | 35.1% | |
| 1880 | 33,381 | 118.0% | |
| 1890 | 101,454 | 203.9% | |
| 1900 | 170,298 | 67.9% | |
| 1910 | 504,131 | 196.0% | |
| 1920 | 936,455 | 85.8% | |
| 1930 | 2,208,492 | 135.8% | |
| 1940 | 2,785,643 | 26.1% | |
| 1950 | 4,151,687 | 49.0% | |
| 1960 | 6,038,771 | 45.5% | |
| 1970 | 7,041,980 | 16.6% | |
| 1980 | 7,477,503 | 6.2% | |
| 1990 | 8,863,164 | 18.5% | |
| 2000 | 9,519,338 | 7.4% | |
| 2010 | 9,818,605 | 3.1% | |
| 2020 | 10,014,009 | 2.0% | |
| 2025 (est.) | 9,694,934 | −3.2% | |
| U.S. Decennial Census 1790–1960 1900–1990 1990–2000 2010 2020 |
| Racial composition as of 2023 07 01 | ||
|---|---|---|
| Total population | 9,663,345 | 100% |
| Hispanics | 4,695,902 | 48.59% |
| Non-Hispanic Whites | 2,369,899 | 24.52% |
| Asians | 1,454,666 | 15.05% |
| Blacks | 709,583 | 7.34% |
| Native Americans | 16,890 | 0.17% |
| Pacific Islanders | 19,128 | 0.20% |
| Multiracial Americans | 336,840 | 3.49% |
| Racial composition | 2020 | 2010 | 2000 | 1990 | 1980 | 1970 | 1960 | 1950 | 1940 |
|---|---|---|---|---|---|---|---|---|---|
| Hispanics | 48.0% | 47.7% | 44.5% | 37.8% | 27.6% | 14.9% | 11% | 5.8% | 2.2% |
| Non-Hispanic Whites | 25.6% | 27.8% | 31.1% | 40.8% | 52.8% | 70.9% | 79.3% | 87.9% | 93.3% |
| Asians | 14.7% | 13.5% | 11.9% | 11% | 5.6% | 2.9% | 1.9% | 1.3% | 1.9% |
| Blacks | 7.6% | 8.3% | 9.7% | 11.1% | 12.6% | 10.8% | 7.6% | 5% | 2.7% |
| Native Americans | 0.2% | 0.2% | 0.8% | 0.5% | 0.64% | 0.35% | 0.13% | - | - |
| Pacific Islanders | 0.2% | 0.2% | - | - | - | - | - | - | - |
| Multiracial Americans | 3.0% | 2.0% | - | - | - | - | - | - | - |

Whites reached their peak number (4,897,580) in 1960. Blacks reached their peak number (931,449) in 1990. Most of the growth has come from Hispanics and Asians.
Los Angeles County is home to the largest numbers of Burmese, Cambodian, Chinese, Filipino, Indonesian, Korean, Sri Lankan, Taiwanese, and Thai outside their respective countries. The largest Asian groups are Chinese (4.0%), Filipino (3.3%), Korean (2.2%), Japanese (1.0%), Vietnamese (0.9%), Indian (0.8%), and Cambodian (0.3%).
The county is home to the largest Armenian population outside of Armenia. It also accommodates the largest Iranian population outside of Iran of any other county or county equivalent globally.
The ASC aggregate data for 2006–2010 show that 43.59% of the population reported speaking only English at home; 39.38% spoke Spanish, 3.64% Chinese, 2.46% Tagalog, 2.02% Korean, 1.70% Armenian, 0.82% Vietnamese, 0.80% Persian, 0.63% Japanese, and 0.52% Russian.
Income

In 2024, the Area Median Income (AMI) for a one-person household in Los Angeles County was $74,600 ($6,217 per month); for a four-person household, $106,600 ($8,883 per month).
As of 2024 12 12, the homeownership rate was 49.81%. As of 2025 12 23, the median home value was $859,958. Multi-unit structures comprised approximately 54.2% of the total housing inventory as of late 2025.
In October 2025, the number of homeless people in the county was 72,195, of which 47,450 were unsheltered. LA County holds the undisputed title for the largest unsheltered homeless population in the nation—in 2024, only 30% of LA's homeless population was sheltered either in an emergency shelter, transitional housing, or a safe haven program, compared to 97% of New York's unhoused.
Religion
In 2015, there were over two thousand Christian churches, the majority of which are Catholic. Roman Catholic adherents number close to 40% of the population. There were 202 Jewish synagogues, 145 Buddhist temples, 38 Muslim mosques, 44 Baháʼí Faith worship centers, 37 Hindu temples, 28 Tenrikyo churches and fellowships, 16 Shinto worship centers, and 14 Sikh gurdwaras in the county. The Roman Catholic Archdiocese of Los Angeles has approximately 5million members and is the largest diocese in the United States. In 2014, the county had 3,275 religious organizations, the most out of all US counties.
Law, government, and politics
Government

The Government of Los Angeles County is defined and authorized under the California Constitution, California law and the Charter of the County of Los Angeles. Much of the Government of California is in practice the responsibility of local governments such as the Government of Los Angeles County.
The county's voters elect a governing five-member Los Angeles County Board of Supervisors. The small size of the board means each supervisor represents over 2million people. The board operates in a legislative, executive, and quasi-judicial capacity. As a legislative authority, it can pass ordinances for the unincorporated areas (ordinances that affect the whole county, like posting of restaurant ratings, must be ratified by the individual city). As an executive body, it can tell the county departments what to do, and how to do it. As a quasi-judicial body, the Board is the final venue of appeal in the local planning process, and holds public hearings on various agenda items.
As of 2020, the Board of Supervisors oversees a $35.5billion annual budget and over 112,000 employees. The county government is managed on a day-to-day basis by a chief executive officer and is organized into many departments, each of which is enormous in comparison to equivalent county-level (and even many state-level) departments anywhere else in the United States. Some of the larger or better-known departments include:

- Los Angeles County Department of Consumer and Business Affairs – offers consumers in the county a variety of services including: consumer and real estate counseling, mediation, and small claims counseling investigates consumer complaints, real estate fraud and identity theft issues. The department also provides small business certifications and helps entrepreneurs navigate the process of opening a business.
- Los Angeles County Superior Court - The primary trial court for Los Angeles County, handling civil, criminal, family, and probate cases.
- Los Angeles County Department of Children and Family Services – administers foster care
- Los Angeles County Fire Department – provides firefighting and emergency medical services for the unincorporated parts and 58 cities of Los Angeles County, as well as for the city of La Habra in Orange County.
- Los Angeles County Department of Health Services – operates several county hospitals and a network of primary care clinics.
- Los Angeles County Department of Public Health – administers public health programs including STD programs, smoking cessation, and restaurant inspection. The cities of Long Beach and Pasadena have their own autonomous Public Health departments assuming county functions, and county public health orders are not applicable in those cities.
- Los Angeles County Department of Public Social Services – administers many federal and state welfare programs
- Los Angeles County Department of Public Works – operates countywide flood control system, constructs and maintains roads in unincorporated areas.
- Los Angeles County District Attorney – prosecutes criminal suspects.
- Los Angeles County Office of the Public Defender – defends indigent people accused of criminal offenses.
- Los Angeles County Probation Department
- Los Angeles County Sheriff's Department – provides law enforcement services for the unincorporated parts of Los Angeles County, as well as 42 cities.
The Los Angeles County Metropolitan Transportation Authority, despite its name, is not a County department. Technically it is a state-mandated county transportation commission that also operates a large bus and rail system in the county.
Politics
| Year | Republican/Whig | Democratic | Third party(ies) | |||
|---|---|---|---|---|---|---|
| No. | % | No. | % | No. | % | |
| 1852 | 496 | 46.36% | 574 | 53.64% | 0 | 0.00% |
| 1856 | 521 | 37.84% | 721 | 52.36% | 135 | 9.80% |
| 1860 | 352 | 20.44% | 475 | 27.58% | 895 | 51.97% |
| 1864 | 555 | 42.73% | 744 | 57.27% | 0 | 0.00% |
| 1868 | 748 | 37.70% | 1,236 | 62.30% | 0 | 0.00% |
| 1872 | 1,311 | 47.24% | 1,228 | 44.25% | 236 | 8.50% |
| 1876 | 3,041 | 45.59% | 3,615 | 54.20% | 14 | 0.21% |
| 1880 | 2,914 | 47.90% | 2,853 | 46.90% | 316 | 5.19% |
| 1884 | 5,595 | 51.67% | 4,683 | 43.24% | 551 | 5.09% |
| 1888 | 13,805 | 54.64% | 10,110 | 40.02% | 1,349 | 5.34% |
| 1892 | 10,226 | 44.89% | 8,119 | 35.64% | 4,434 | 19.47% |
| 1896 | 16,891 | 49.62% | 16,043 | 47.13% | 1,108 | 3.25% |
| 1900 | 19,200 | 55.10% | 13,158 | 37.76% | 2,490 | 7.15% |
| 1904 | 32,507 | 66.50% | 10,030 | 20.52% | 6,346 | 12.98% |
| 1908 | 41,483 | 56.77% | 22,076 | 30.21% | 9,518 | 13.02% |
| 1912 | 2,181 | 1.32% | 55,110 | 33.34% | 108,005 | 65.34% |
| 1916 | 135,554 | 50.59% | 114,070 | 42.58% | 18,297 | 6.83% |
| 1920 | 178,117 | 69.10% | 55,661 | 21.59% | 23,992 | 9.31% |
| 1924 | 299,675 | 65.51% | 33,554 | 7.33% | 124,228 | 27.16% |
| 1928 | 513,526 | 70.22% | 209,945 | 28.71% | 7,830 | 1.07% |
| 1932 | 373,738 | 38.55% | 554,476 | 57.19% | 41,380 | 4.27% |
| 1936 | 357,401 | 31.62% | 757,351 | 67.00% | 15,663 | 1.39% |
| 1940 | 574,266 | 40.58% | 822,718 | 58.13% | 18,285 | 1.29% |
| 1944 | 666,441 | 42.68% | 886,252 | 56.75% | 8,871 | 0.57% |
| 1948 | 804,232 | 46.51% | 812,690 | 47.00% | 112,160 | 6.49% |
| 1952 | 1,278,407 | 56.21% | 971,408 | 42.71% | 24,725 | 1.09% |
| 1956 | 1,260,206 | 55.38% | 1,007,887 | 44.29% | 7,331 | 0.32% |
| 1960 | 1,302,661 | 49.45% | 1,323,818 | 50.25% | 8,020 | 0.30% |
| 1964 | 1,161,067 | 42.52% | 1,568,300 | 57.43% | 1,551 | 0.06% |
| 1968 | 1,266,480 | 47.65% | 1,223,251 | 46.02% | 168,251 | 6.33% |
| 1972 | 1,549,717 | 54.75% | 1,189,977 | 42.04% | 90,676 | 3.20% |
| 1976 | 1,174,926 | 47.78% | 1,221,893 | 49.69% | 62,258 | 2.53% |
| 1980 | 1,224,533 | 50.18% | 979,830 | 40.15% | 235,822 | 9.66% |
| 1984 | 1,424,113 | 54.50% | 1,158,912 | 44.35% | 29,889 | 1.14% |
| 1988 | 1,239,716 | 46.88% | 1,372,352 | 51.89% | 32,603 | 1.23% |
| 1992 | 799,607 | 29.04% | 1,446,529 | 52.54% | 507,267 | 18.42% |
| 1996 | 746,544 | 30.96% | 1,430,629 | 59.34% | 233,841 | 9.70% |
| 2000 | 871,930 | 32.35% | 1,710,505 | 63.47% | 112,719 | 4.18% |
| 2004 | 1,076,225 | 35.60% | 1,907,736 | 63.10% | 39,319 | 1.30% |
| 2008 | 956,425 | 28.82% | 2,295,853 | 69.19% | 65,970 | 1.99% |
| 2012 | 885,333 | 27.83% | 2,216,903 | 69.69% | 78,831 | 2.48% |
| 2016 | 769,743 | 22.41% | 2,464,364 | 71.76% | 200,201 | 5.83% |
| 2020 | 1,145,530 | 26.86% | 3,028,885 | 71.03% | 89,950 | 2.11% |
| 2024 | 1,189,862 | 31.91% | 2,417,109 | 64.82% | 122,118 | 3.27% |
Overview
Voter registration
| Population and registered voters (Sept. 2025) | ||
|---|---|---|
| Total population | 9,757,179 | |
| Registered voters | 5,834,380 | 59.8% |
| Democratic | 2,988,634 | 51.2% |
| Republican | 1,098,884 | 18.8% |
| Democratic–Republican spread | +1,889,750 | +32.4% |
| American Independent | 200,191 | 3.4% |
| Libertarian | 48,197 | 0.8% |
| Peace and Freedom | 43,165 | 0.7% |
| Green | 28,444 | 0.5% |
| Unknown | 32,209 | 0.5% |
| Other | 45,961 | 0.8% |
| No party preference | 1,348,695 | 23.1% |
In the United States House of Representatives, Los Angeles County is split between 17 congressional districts. In the California State Senate, Los Angeles County is split between 13 legislative districts. In the California State Assembly, Los Angeles County is split between 24 legislative districts.
On November 4, 2008, Los Angeles County was almost evenly split over Proposition 8, which amended the California Constitution to ban same-sex marriages. The county voted for the amendment 50.04% with a margin of 2,385 votes.
Legal system
The Los Angeles County Superior Court is the county's court of general jurisdiction, while the U.S. District Court for the Central District of California may hear cases where federal jurisdiction is present. Both are headquartered in a large cluster of government buildings in the city's Civic Center.
Historically, the courthouses were county-owned buildings that were maintained at county expense, which created significant friction since the trial court judges, as officials of the state government, had to lobby the county Board of Supervisors for facility renovations and upgrades. In turn, the state judiciary successfully persuaded the state Legislature to authorize the transfer of all courthouses to the state government in 2008 and 2009 (so that judges would have direct control over their own courthouses). Courthouse security is still provided by the county government under a contract with the state.
Unlike the largest city in the United States, New York City, all of the city of Los Angeles and most of its important suburbs are located within a single county. As a result, both the county superior court and the federal district court are respectively the busiest courts of their type in the nation.
Many celebrities have been seen in Los Angeles courts. In 2003, the television show Extra (based in nearby Glendale) found itself running so many reports on the legal problems of local celebrities that it spun them off into a separate show, Celebrity Justice.
State cases are appealed to the Court of Appeal for the Second Appellate District, which is also headquartered in the Civic Center, and then to the California Supreme Court, which is headquartered in San Francisco but also hears argument in Los Angeles (again, in the Civic Center). Federal cases are appealed to the Court of Appeals for the Ninth Circuit, which hears them at its branch building in Pasadena. The court of last resort for federal cases is the U.S. Supreme Court in Washington, D.C.
Crime
The following table includes the number of incidents reported and the rate per 1,000 persons for each type of offense.
| Population and crime rates (2011) | ||
|---|---|---|
| Population | 9,787,747 | |
| Violent crime | 54,747 | 5.59 |
| Homicide | 699 | 0.07 |
| Forcible rape | 2,114 | 0.22 |
| Robbery | 24,528 | 2.51 |
| Aggravated assault | 27,406 | 2.80 |
| Property crime | 155,583 | 15.90 |
| Burglary | 50,558 | 5.17 |
| Larceny-theft | 144,589 | 14.77 |
| Motor vehicle theft | 46,710 | 4.77 |
| Arson | 2,815 | 0.29 |
Cities by population and crime rates
| Cities by population and crime rates (2012) | |||||
|---|---|---|---|---|---|
| City | Population | Violent crimes | Violent crime rate per 1,000 persons | Property crimes | Property crime rate per 1,000 persons |
| Agoura Hills | 20,667 | 12 | 0.58 | 236 | 11.42 |
| Alhambra | 84,469 | 149 | 1.76 | 1,919 | 22.72 |
| Arcadia | 57,295 | 57 | 0.99 | 1,388 | 24.23 |
| Artesia | 16,793 | 60 | 3.57 | 262 | 15.60 |
| Avalon | 3,795 | 13 | 3.43 | 64 | 16.86 |
| Azusa | 47,111 | 220 | 4.67 | 1,204 | 25.56 |
| Baldwin Park | 76,644 | 261 | 3.41 | 1,585 | 20.68 |
| Bell | 36,062 | 225 | 6.24 | 662 | 18.36 |
| Bellflower | 77,886 | 304 | 3.90 | 1,802 | 23.14 |
| Bell Gardens | 42,769 | 125 | 2.92 | 728 | 17.02 |
| Beverly Hills | 34,677 | 89 | 2.57 | 1,081 | 31.17 |
| Bradbury | 1,067 | 0 | 0.00 | 10 | 9.37 |
| Burbank | 105,057 | 243 | 2.31 | 2,493 | 23.73 |
| Calabasas | 23,442 | 13 | 0.55 | 238 | 10.15 |
| Carson | 93,233 | 520 | 5.58 | 2,709 | 29.06 |
| Cerritos | 49,856 | 120 | 2.41 | 1,870 | 37.51 |
| Claremont | 35,469 | 40 | 1.13 | 901 | 25.40 |
| Commerce | 13,035 | 112 | 8.59 | 1,010 | 77.48 |
| Compton | 98,057 | 1,218 | 12.42 | 2,399 | 24.47 |
| Covina | 48,588 | 151 | 3.11 | 1,651 | 33.98 |
| Cudahy | 24,201 | 151 | 6.24 | 347 | 14.34 |
| Culver City | 39,528 | 179 | 4.53 | 1,760 | 44.53 |
| Diamond Bar | 56,470 | 55 | 0.97 | 952 | 16.86 |
| Downey | 113,628 | 381 | 3.35 | 3,537 | 31.13 |
| Duarte | 21,673 | 71 | 3.28 | 507 | 23.39 |
| El Monte | 115,356 | 395 | 3.42 | 2,230 | 19.33 |
| El Segundo | 16,931 | 38 | 2.24 | 595 | 35.14 |
| Gardena | 59,802 | 287 | 4.80 | 1,321 | 22.09 |
| Glendale | 194,902 | 233 | 1.20 | 3,043 | 15.61 |
| Glendora | 50,903 | 59 | 1.16 | 1,293 | 25.40 |
| Hawaiian Gardens | 14,493 | 69 | 4.76 | 193 | 13.32 |
| Hawthorne | 85,692 | 637 | 7.43 | 2,181 | 25.45 |
| Hermosa Beach | 19,830 | 54 | 2.72 | 678 | 34.19 |
| Hidden Hills | 1,887 | 0 | 0.00 | 4 | 2.12 |
| Huntington Park | 59,079 | 373 | 6.31 | 1,917 | 32.45 |
| Industry | 222 | 68 | 306.31 | 1,110 | 5,000.00 |
| Inglewood | 111,488 | 780 | 7.00 | 2,673 | 23.98 |
| Irwindale | 1,447 | 15 | 10.37 | 243 | 167.93 |
| La Canada Flintridge | 20,584 | 12 | 0.58 | 324 | 15.74 |
| La Habra Heights | 5,413 | 6 | 1.11 | 44 | 8.13 |
| Lakewood | 81,382 | 227 | 2.79 | 2,062 | 25.34 |
| La Mirada | 49,312 | 98 | 1.99 | 776 | 15.74 |
| Lancaster | 159,155 | 859 | 5.40 | 3,498 | 21.98 |
| La Puente | 40,479 | 121 | 2.99 | 521 | 12.87 |
| La Verne | 31,575 | 50 | 1.58 | 823 | 26.06 |
| Lawndale | 33,312 | 167 | 5.01 | 397 | 11.92 |
| Lomita | 20,591 | 95 | 4.61 | 391 | 18.99 |
| Long Beach | 469,893 | 2,705 | 5.76 | 14,131 | 30.07 |
| Los Angeles | 3,855,122 | 18,547 | 4.81 | 87,478 | 22.69 |
| Lynwood | 70,908 | 541 | 7.63 | 1,373 | 19.36 |
| Malibu | 12,854 | 15 | 1.17 | 329 | 25.60 |
| Manhattan Beach | 35,719 | 62 | 1.74 | 855 | 23.94 |
| Maywood | 27,850 | 175 | 6.28 | 286 | 10.27 |
| Monrovia | 37,199 | 81 | 2.18 | 948 | 25.48 |
| Montebello | 63,538 | 146 | 2.30 | 1,775 | 27.94 |
| Monterey Park | 61,270 | 75 | 1.22 | 1,022 | 16.68 |
| Norwalk | 107,295 | 433 | 4.04 | 2,609 | 24.32 |
| Palmdale | 155,294 | 812 | 5.23 | 3,393 | 21.85 |
| Palos Verdes Estates | 13,661 | 6 | 0.44 | 136 | 9.96 |
| Paramount | 54,997 | 244 | 4.44 | 1,536 | 27.93 |
| Pasadena | 139,382 | 433 | 3.11 | 3,379 | 24.24 |
| Pico Rivera | 63,988 | 261 | 4.08 | 1,780 | 27.82 |
| Pomona | 151,511 | 1,021 | 6.74 | 5,055 | 33.36 |
| Rancho Palos Verdes | 42,335 | 35 | 0.83 | 498 | 11.76 |
| Redondo Beach | 67,856 | 190 | 2.80 | 1,596 | 23.52 |
| Rolling Hills | 1,891 | 0 | 0.00 | 27 | 14.28 |
| Rolling Hills Estates | 8,202 | 9 | 1.10 | 129 | 15.73 |
| Rosemead | 54,656 | 143 | 2.62 | 913 | 16.70 |
| San Dimas | 33,923 | 51 | 1.50 | 668 | 19.69 |
| San Fernando | 24,039 | 77 | 3.20 | 380 | 15.81 |
| San Gabriel | 40,376 | 88 | 2.18 | 550 | 13.62 |
| San Marino | 13,364 | 13 | 0.97 | 183 | 13.69 |
| Santa Clarita | 179,248 | 342 | 1.91 | 2,742 | 15.30 |
| Santa Fe Springs | 16,492 | 99 | 6.00 | 1,272 | 77.13 |
| Santa Monica | 91,215 | 395 | 4.33 | 3,398 | 37.25 |
| Sierra Madre | 11,098 | 4 | 0.36 | 112 | 10.09 |
| Signal Hill | 11,198 | 43 | 3.84 | 536 | 47.87 |
| South El Monte | 20,452 | 88 | 4.30 | 399 | 19.51 |
| South Gate | 95,966 | 553 | 5.76 | 2,545 | 26.52 |
| South Pasadena | 26,045 | 27 | 1.04 | 443 | 17.01 |
| Temple City | 36,148 | 38 | 1.05 | 354 | 9.79 |
| Torrance | 147,851 | 190 | 1.29 | 2,690 | 18.19 |
| Vernon | 114 | 27 | 236.84 | 311 | 2,728.07 |
| Walnut | 29,658 | 37 | 1.25 | 382 | 12.88 |
| West Covina | 107,861 | 281 | 2.61 | 3,224 | 29.89 |
| West Hollywood | 34,971 | 338 | 9.67 | 1,642 | 46.95 |
| Westlake Village | 8,406 | 3 | 0.36 | 154 | 18.32 |
| Whittier | 86,740 | 247 | 2.85 | 2,502 | 28.84 |
Other statistics
Crime in 2013
- Homicides: 386
- Thefts: 54,971
- Burglaries: 17,606
- Car Thefts: 15,866
- Robberies: 10,202
- Violent Crimes: 20,318
- Rapes: 843
- Assaults: 8,976
- Murders: 297
Ecology

According to the authors of Wild L.A., a book about urban biodiversity, "Los Angeles is the birdiest county in the country with over 500 recorded species." LA's amenable climate supports a large number of introduced, tropical and migratory species, such as tropical parrots that snack on the local ornamental and edible fruit trees, including dates, figs, and loquats. Because of the county's wide range of biomes it is possible to see desert bighorn sheep and green sea turtles in the same day, without crossing the county line. The range of habitats in the county is "greater than in many states, with mountains, wetlands, desert, ocean, meadows and chaparral, each with its own endemic species." There are at least 100 species of trees, and 1000 species of non-native plants, in the urban areas of the county. Charismatic biodiversity indicator species native to the area include three species of amphibian (Baja California chorus frog, black-bellied slender salamander, western toad), 14 species of bird (acorn woodpecker, California quail, canyon wren, cinnamon teal, great blue heron, great horned owl, greater roadrunner, hooded merganser, Northern harrier, red-tailed hawk, red-winged blackbird, spotted towhee, western bluebird, western meadowlark), nine kinds of invertebrates (Behr's metalmark, bramble green hairstreak, bumblebees, El Segundo blue butterfly, harvester ants, Lorquin's admiral, North American Jerusalem crickets, Sara orangetip, velvet ants), five mammals (bobcat, dusky footed woodrat, gray fox, mountain lion, mule deer), and six reptiles (California kingsnake, coachwhip snake, gopher snake, side-blotched lizard, western pond turtle, western rattlesnake). Any observations of these species within the county are considered ecologically significant indicators of ecosystem health and may be documented using the iNaturalist app.
Economy

Los Angeles County is commonly associated with the entertainment and digital media industry; all five major film studios—Paramount Pictures, Sony Pictures, Warner Bros., Universal Pictures, and Walt Disney Studios—are located within the county. Numerous other major industries also define the economy of Los Angeles County, including international trade supported by the Port of Los Angeles and the Port of Long Beach, music recording and production, aerospace and defense, fashion, and professional services such as law, medicine, engineering and design services, financial services. High-tech sector employment within Los Angeles County is 368,500 workers, and manufacturing employment within Los Angeles County is 365,000 workers. Despite a business exodus from Downtown Los Angeles since the COVID-19 pandemic, the city's urban core is evolving as a cultural center with the world's largest showcase of architecture designed by Frank Gehry.
The following major companies have headquarters in Los Angeles County:
Education
The Los Angeles County Office of Education provides a supporting role for school districts in the area. The county office also operates two magnet schools, the International Polytechnic High School and Los Angeles County High School for the Arts. There are a number of private schools in the county, most notably those operated by the Roman Catholic Archdiocese. The county's public education sector is run by numerous school districts with the Los Angeles Unified School District being the largest one running public schools primarily within the city of Los Angeles and its immediately neighboring cities.
Colleges
- Antelope Valley College, Lancaster
- Art Center College of Design, Pasadena
- The Art Institute of California – Los Angeles (AICALA), Santa Monica
- Azusa Pacific University, Azusa
- Biola University, La Mirada
- California Institute of the Arts, Santa Clarita
- Cerritos College, Norwalk
- Citrus College, Glendora
- Claremont Colleges, Claremont Claremont McKenna College Harvey Mudd College Pitzer College Pomona College Scripps College
- Claremont School of Theology, Claremont
- College of the Canyons, Santa Clarita
- DeVry University, Long Beach and West Hills (Los Angeles)
- East Los Angeles College, Monterey Park
- El Camino College, Torrance
- Fuller Theological Seminary, Pasadena
- Glendale Community College, Glendale
- Hebrew Union College, Los Angeles
- ITT Technical Institute, Culver City, San Dimas, Sylmar (Los Angeles), Torrance, and West Covina
- Life Pacific College, San Dimas
- Long Beach City College, Long Beach
- Los Angeles City College (LACC), Los Angeles
- Los Angeles Harbor College, Los Angeles
- Los Angeles Mission College, Sylmar (Los Angeles)
- Los Angeles Music Academy College of Music, Pasadena
- Los Angeles Pierce College (Pierce), Woodland Hills (Los Angeles)
- Los Angeles Southwest College, Los Angeles
- Los Angeles Trade Technical College (LATTC), Los Angeles
- Los Angeles Valley College, Valley Glen (Los Angeles)
- The Master's University, Santa Clarita
- Mount St. Mary's College, Los Angeles
- Mt. San Antonio College, Walnut
- , Monrovia
- Occidental College (Oxy), Eagle Rock (Los Angeles)
- Otis College of Art and Design, Westchester (Los Angeles)
- Pacific Oaks College, Pasadena
- Pasadena City College, Pasadena
- Pepperdine University, Malibu
- Rio Hondo College, Whittier
- Santa Monica College (SMC), Santa Monica
- West Los Angeles College, Culver City
- Whittier College, Whittier
- Wyoming Technical Institute (WyoTech), Long Beach
Universities
- Abraham Lincoln University (ALU), Los Angeles
- Alliant International University (AIU), Alhambra
- American Jewish University (AJULA), Los Angeles
- Azusa Pacific University, Azusa
- Biola University, La Mirada
- California Institute of Technology (Caltech), Pasadena
- California State Polytechnic University, Pomona (Cal Poly Pomona), Pomona
- California State University, Dominguez Hills (CSUDH), Carson
- California State University, Long Beach (CSULB), Long Beach
- California State University, Los Angeles (CSULA), Los Angeles
- California State University, Northridge (CSUN), Northridge (Los Angeles)
- Charles R. Drew University of Medicine and Science (Los Angeles)
- Claremont Graduate University (CGU), Claremont
- Loyola Marymount University (LMU), Westchester (Los Angeles)
- National University, Los Angeles and Woodland Hills
- Pepperdine University, Malibu
- Southern California University of Health Sciences, Whittier
- Southern California Institute of Architecture (SCI-Arc), Los Angeles
- Southwestern University School of Law, Los Angeles
- University of Antelope Valley (UAV), Lancaster
- University of California, Los Angeles (UCLA), Westwood (Los Angeles)
- University of La Verne, La Verne
- University of Southern California (USC), Los Angeles
- University of the West (UWest), Rosemead
- Western University of Health Sciences (WesternU), Pomona
- Woodbury University, Burbank
K–12 schools
Sites of interest
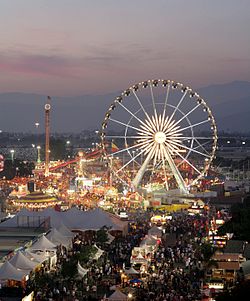

The county's most visited park is Griffith Park, owned by the city of Los Angeles. The county is also known for the annual Rose Parade in Pasadena, the annual Los Angeles County Fair in Pomona, the Los Angeles County Museum of Art, the Los Angeles Zoo, the Natural History Museum of Los Angeles County, the La Brea Tar Pits, the Arboretum of Los Angeles, and two horse racetracks and two car racetracks (Pomona Raceway and Irwindale Speedway), also the RMSQueen Mary located in Long Beach, and the Long Beach Grand Prix, and miles of beaches—from Zuma to Cabrillo.
Venice Beach is a popular attraction whose Muscle Beach used to attract throngs of tourists admiring "hardbodies". Today, it is more arts-centered. Santa Monica's pier is a well known tourist spot, famous for its Ferris wheel and bumper car rides, which were featured in the introductory segment of the television sitcom Three's Company. Further north in Pacific Palisades one finds the beaches used in the television series Baywatch. The fabled Malibu, home of many film and television stars, lies west of it.
In the mountain, canyon, and desert areas one may find Vasquez Rocks Natural Area Park, where many old Westerns were filmed. Mount Wilson Observatory in the San Gabriel Mountains is open for the public to view astronomical stars from its telescope, now computer-assisted. Many county residents find relaxation in water skiing and swimming at Castaic Lake Recreation Area – the county's largest park by area – as well as enjoying natural surroundings and starry nights at Saddleback Butte State Park in the eastern Antelope Valley – California State Parks' largest in area within the county. The California Poppy Reserve is located in the western Antelope Valley and shows off the State's flower in great quantity on its rolling hills every spring.
Museums
- Academy Museum of Motion Pictures
- Armory Center for the Arts, Pasadena, California
- Battleship USS Iowa, Los Angeles Waterfront in San Pedro
- SSLane Victory, Los Angeles Waterfront in San Pedro, just south of the USS Iowa
- California African American Museum
- California Science Center, Los Angeles (formerly the Museum of Science and Industry)
- The Broad
- Hammer Museum
- Huntington Library, San Marino
- Long Beach Museum of Art in the historic Elizabeth Milbank Anderson residence
- Los Angeles Children's Museum
- Los Angeles County Fire Museum, in Bellflower
- Los Angeles County Museum of Art, Mid-City, Los Angeles
- Lucas Museum of Narrative Art
- Museum of Contemporary Art, Downtown Los Angeles (founded in 1950); The Geffen Contemporary at MOCA, Downtown Los Angeles (founded in 1980)
- Museum of Jurassic Technology, Culver City
- Museum of Latin American Art in Long Beach
- Museum of Neon Art
- Museum of the American West (Gene Autry Museum), in Griffith Park
- Museum of Tolerance
- Natural History Museum of Los Angeles County
- Pasadena Museum of California Art, in Pasadena
- J. Paul Getty Center, Brentwood (Ancient Roman, Greek, and European Renaissance Art)
- J. Paul Getty Villa, Pacific Palisades, Getty's original house
- George C. Page Museum at La Brea Tar Pits
- Santa Monica Museum of Art, Santa Monica (Contemporary art)
- Norton Simon Museum, Pasadena (19th- and early 20th-century art)
- Skirball Cultural Center, Los Angeles
- Southwest Museum
Entertainment
- Los Angeles Memorial Coliseum
- Descanso Gardens
- Dodger Stadium
- Exposition Park
- Farmers Market
- The Forum
- Griffith Park
- Griffith Observatory
- Huntington Botanical Gardens
- La Brea Tar Pits
- Music Center
- Olvera Street
- Crypto.com Arena
- SoFi Stadium
- South Coast Botanic Garden
- Third Street Promenade
- Venice Beach
- Los Angeles Zoo
- Santa Fe Dam Recreation Area
Music venues

- California Plaza, comprising One California Plaza and Two California Plaza
- Cerritos Center for the Performing Arts
- Crypto.com Arena
- The Forum
- Walt Disney Concert Hall
- Greek Theatre
- House of Blues Sunset Strip
- Pantages Theatre
- Hollywood Bowl
- Hollywood Palladium
- John Anson Ford Amphitheatre
- The Orpheum Theatre
- The Roxy Theatre
- Royce Hall (UCLA)
- The Music Box
- El Rey Theatre
- The Troubadour
- The Wiltern
- Whisky a Go Go
Amusement parks
- Universal Studios Hollywood
- Raging Waters, San Dimas
- Six Flags Magic Mountain
- Six Flags Hurricane Harbor
- Pacific Park
Other attractions
| U.S. Bank Tower Wilshire Grand Tower Central Los Angeles Library Watts Towers Wayfarers Chapel | Fo Guang Shan Hsi Lai Temple Cathedral of Our Lady of the Angels Queen Mary |
Other areas

- Ridge Route
- Angeles National Forest
- Mount Wilson Observatory
- Malibu Creek State Park
- Vasquez Rocks Natural Area Park
- Plant 42's Blackbird Airpark and Heritage Airpark
- Antelope Valley California Poppy Reserve
- Cortes Bank
- Santa Catalina Island
- Mojave Desert
- Saddleback Butte State Park
- Antelope Valley Indian Museum State Historic Park
- Arthur B. Ripley Desert Woodland State Park
Transportation
Major highways
- I-5 I-5 BL (San Fernando Road)
- I-10
- I-105
- I-110/ SR110 (Harbor Freeway/ Arroyo Seco Parkway)
- I-210/ SR210 (Foothill Freeway)
- I-405
- I-605
- I-710/ SR710– SR710 is unsigned
- US101
- SR1 (Pacific Coast Highway)
- SR2
- SR14– former US6
- SR18
- SR19/ SR164
- SR22
- SR23
- SR27
- SR39
- SR47
- SR57
- SR60– former US60
- SR66 (Foothill Boulevard)– former US66
- SR71
- SR72
- SR90
- SR91– former US91
- SR103
- SR107
- SR118
- SR126
- SR134
- SR138
- SR170
- SR213
Air

Los Angeles International Airport (LAX), located in the Westchester district, is the primary commercial airport for commercial airlines in the county and the Greater Los Angeles Area. LAX is operated by Los Angeles World Airports (LAWA), an agency of the City of Los Angeles.
Other important commercial airports in Los Angeles County include:
- Long Beach Municipal Airport operated by the City of Long Beach.
- Hollywood Burbank Airport in Burbank, operated by the Burbank-Glendale-Pasadena Airport Authority.
The following general aviation airports also are located in Los Angeles County:
- County-operated airports (Department of Public Works, Aviation Division) Compton/Woodley Airport in Compton. San Gabriel Valley Airport in El Monte. Brackett Field in La Verne. Whiteman Airport in Pacoima. General William J. Fox Airfield in Lancaster.
- City-operated airports Van Nuys Airport in Van Nuys, also operated by LAWA. Van Nuys Airport sees significant executive jet air traffic. LA/Palmdale Regional Airport in Palmdale. The airport is a separate facility on the grounds of Air Force Plant 42. Santa Monica Airport in Santa Monica, which has major executive jet traffic. Hawthorne Municipal Airport, also known as Jack Northrop Field, in Hawthorne. Zamperini Field in Torrance.
The U.S. Air Force operates three airports in Los Angeles County:
- Portions of Edwards Air Force Base, located at the northern edge of the county.
- Air Force Plant 42 in Palmdale, sharing runways with LA/Palmdale Regional.
- The non-flying Los Angeles Air Force Base in El Segundo.
Rail
Los Angeles is a major freight-railroad transportation center, in great part due to the large volumes of freight moving in and out of the county's seaport facilities. The ports are connected to the downtown rail yards and to the main lines of Union Pacific and Burlington Northern Santa Fe headed east via a grade-separated freight rail corridor known as the Alameda Corridor.
Passenger rail service is provided in the county by Amtrak, Los Angeles Metro Rail and Metrolink.
Amtrak has the following intercity Amtrak service at Union Station in the city of Los Angeles:
- The Pacific Surfliner to Santa Barbara, San Luis Obispo, and San Diego.
- The Coast Starlight to San Francisco Bay Area, Portland and Seattle.
- The Southwest Chief to Albuquerque, Kansas City and Chicago.
- The Sunset Limited to Tucson, Houston and New Orleans.
Union Station is also the primary hub for Metrolink commuter rail, which serves much of the Greater Los Angeles Area.
Light rail, subway (heavy rail), and long-distance bus service are all provided by the Los Angeles County Metropolitan Transportation Authority (Metro). Other smaller regional transit agencies that provide public transit to specific regions of Los Angeles County include LADOT, Long Beach Transit, Montebello Bus Lines, Norwalk Transit, Santa Monica's Big Blue Bus serving the western LA region, Santa Clarita Transit, Torrance Transit, Glendale Beeline, Foothill Transit serving the San Gabriel Valley region, and the Antelope Valley Transit Authority serving the Lancaster and Palmdale area in the Antelope Valley region.
Sea
The county's two main seaports are the Port of Los Angeles and the Port of Long Beach. Together they handle over a quarter of all container traffic entering the United States, making the complex the largest and most important port in the country, and the third-largest port in the world by shipping volume.
The Port of Los Angeles is the largest cruise ship center on the West Coast, handling more than 1million passengers annually.
The Port of Long Beach is home to the Sea Launch program, which uses a floating launch platform to insert payloads into orbits that would be difficult to attain from existing land-based launch sites.
Catalina Express ferries link the Catalina Island city of Avalon to the mainland at San Pedro and Long Beach, as well as Dana Point in Orange County.
Water

Water is provided by at least 200 independent water districts or agencies. Statewide droughts in California have placed a strain on the county's water security.
Communities
Cities
There are 88 incorporated cities in Los Angeles County. According to the 2024 Estimate, the most populous are:
| City | Population |
|---|---|
| Los Angeles | 3,878,704 |
| Long Beach | 450,901 |
| Santa Clarita | 229,159 |
| Glendale | 187,823 |
| Lancaster | 167,426 |
| Palmdale | 162,536 |
| Pomona | 147,966 |
| Torrance | 139,576 |
| Pasadena | 137,195 |
| Downey | 109,368 |
| West Covina | 106,920 |
| El Monte | 104,639 |
| Burbank | 103,533 |
| Inglewood | 102,774 |
Unincorporated areas
Census-designated places
- Acton
- Agua Dulce
- Alondra Park
- Altadena
- Avocado Heights
- Castaic
- Charter Oak
- Citrus
- Del Aire
- Desert View Highlands
- East Los Angeles
- East Pasadena
- East Rancho Dominguez
- East San Gabriel
- East Whittier
- Elizabeth Lake
- Florence-Graham
- Green Valley
- Hacienda Heights
- Hasley Canyon
- La Crescenta-Montrose
- Ladera Heights
- Lake Hughes
- Lake Los Angeles
- Lennox
- Leona Valley
- Littlerock
- Marina del Rey
- Mayflower Village
- North El Monte
- Pepperdine University
- Quartz Hill
- Rose Hills
- Rowland Heights
- San Pasqual
- South Monrovia Island
- South San Gabriel
- South San Jose Hills
- South Whittier
- Stevenson Ranch
- Sun Village
- Topanga
- Val Verde
- Valinda
- View Park-Windsor Hills
- Vincent
- Walnut Park
- West Athens
- West Carson
- West Rancho Dominguez
- West Puente Valley
- West Whittier-Los Nietos
- Westmont
- Willowbrook
Other unincorporated communities
- Agoura
- Alla
- Alpine
- Andrade Corner
- Antelope Acres
- Antelope Center
- Athens
- Bassett
- Big Pines
- Castaic Junction
- City Terrace
- Cornell
- Del Sur
- Del Valle
- Firestone Park
- Florence
- Gorman
- Hillgrove
- Hi Vista
- Juniper Hills
- Kagel Canyon
- Kinneloa Mesa
- Largo Vista
- Llano
- Los Nietos
- Malibu Vista
- Monte Nido
- Neenach
- Ninetynine Oaks
- Pearblossom
- Rancho Dominguez
- Sandberg
- Sand Canyon
- Seminole Hot Springs
- Three Points
- Two Harbors
- Universal City
- Valyermo
- West Whitter
Proposed communities
- Centennial (planned for 70,000).
See:
See also
- List of museums in Los Angeles
- List of museums in Los Angeles County, California
- List of school districts in Los Angeles County, California
- List of schools in the Roman Catholic Archdiocese of Los Angeles
- National Register of Historic Places listings in Los Angeles County, California
Notes
3.^ Mayor-Council In 2032