Philadelphia metropolitan area
In-game article clicks load inline without leaving the challenge.
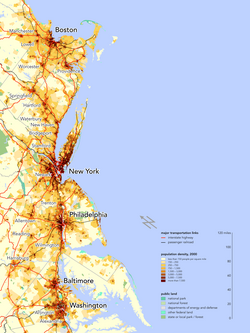
The Philadelphia metropolitan area, also referred to as the Delaware Valley or Greater Philadelphia, is a major metropolitan area in the Northeastern United States that centers on Philadelphia, the sixth-most populous city in the United States. This area spans up to four states: southeastern Pennsylvania, southern New Jersey, northern Delaware, and the northern Eastern Shore of Maryland, though it is sometimes considered a tri-state region if northeastern Maryland is excluded. With a core metropolitan statistical area population of 6.245 million residents and a combined statistical area population of 7.379 million as of the 2020 census, it is the ninth-largest metropolitan area in the United States in 2024 and the 68th-largest metropolitan region in the world.
In addition to Philadelphia, other major population centers in the Philadelphia metro area include Reading, Upper Darby Township, and Chester in Pennsylvania; Atlantic City, Camden, Vineland, and Cherry Hill in South Jersey; and Wilmington and Dover in Delaware. As of 2023, the Philadelphia metro area's gross domestic product (GDP) exceeds US$557 billion, making it the nation's 11th-largest metropolitan economy.
The Philadelphia metropolitan area has been influential in the nation's history and economy and home to many people and sites significant to American culture, history, and politics. Philadelphia is sometimes known as "The Birthplace of America" in reference to its role as the revolutionary capital during the colonial era in which the Second Continental Congress gathered at Independence Hall and unanimously adopted the Declaration of Independence, authorized the formation of the Continental Army, and appointed George Washington its commander to resist the British. After the Continental Army's victory, Philadelphia served as the nation's first capital for most of the 18th century until 1800, when construction of Washington, D.C. was completed. The U.S. Constitution, the world's longest-standing body of federal law, was ratified at Independence Hall in Philadelphia in 1789.
The metro area is one of the nation's leading regions for academia and academic research with a considerable number of globally-known and highly ranked universities, including the University of Pennsylvania, one of the nation's eight Ivy League universities. Other major universities and colleges in the region include Swarthmore College, Drexel University, La Salle University, Bryn Mawr College, Rowan University, Rutgers University–Camden, Saint Joseph's University, Stockton University, Temple University, Thomas Jefferson University, the University of Delaware, Villanova University, West Chester University, Widener University, Ursinus College, Haverford College, the Pennsylvania Academy of the Fine Arts, the Moore College of Art and Design, the Tyler School of Art and Architecture, and others.
The Philadelphia metropolitan area is considered a biotechnology hub, and has garnered the nickname "Cellicon Valley" for its central role in the development of immunotherapies to treat different cancers. As of 2025, the area ranks as one of the Big Five U.S. venture capital hubs, facilitated by its proximity to both New York City's entrepreneurial and financial ecosystems and to the federal regulatory environment of Washington, D.C. Elsewhere in the metropolitan area, South Jersey has emerged as an East Coast epicenter for logistics and major warehouses.
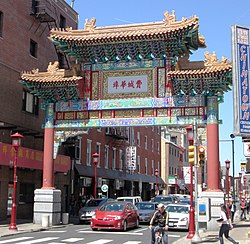
Culturally, the region is home to the dialect known as Philadelphia English, shares a unique cuisine known as Philadelphia cuisine, has played a formidable role in popular music, and is known for having one of the nation's most passionate and devoted sports cultures centered around its five professional sports teams.
Geography and population
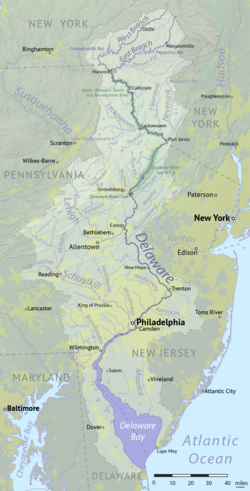
The Philadelphia metropolitan area is geographically associated and proximate to the Delaware River and its three primary tributaries, the Schuylkill River, Lehigh River, and Brandywine Creek.
U.S. government agencies have reached various definitions of metropolitan Philadelphia. The Office of Management and Budget (OMB) defines metropolitan statistical area (MSAs), which are regions with relatively high population densities at their cores and close economic ties throughout their respective areas. MSAs are further combined into combined statistical areas (CSAs), reflecting commuting patterns. Neither is a formal administrative division.
Metropolitan statistical area (MSA)
| Census | Pop. | Note | %± |
|---|---|---|---|
| 1820 | 171,430 | — | |
| 1830 | 228,203 | 33.1% | |
| 1840 | 305,278 | 33.8% | |
| 1850 | 467,053 | 53.0% | |
| 1860 | 636,029 | 36.2% | |
| 1870 | 841,230 | 32.3% | |
| 1880 | 1,062,677 | 26.3% | |
| 1890 | 1,391,157 | 30.9% | |
| 1900 | 1,892,496 | 36.0% | |
| 1910 | 2,268,209 | 19.9% | |
| 1920 | 2,714,271 | 19.7% | |
| 1930 | 3,137,040 | 15.6% | |
| 1940 | 3,299,637 | 5.2% | |
| 1950 | 3,671,048 | 11.3% | |
| 1960 | 4,757,462 | 29.6% | |
| 1970 | 5,317,407 | 11.8% | |
| 1980 | 5,240,039 | −1.5% | |
| 1990 | 5,435,468 | 3.7% | |
| 2000 | 5,687,147 | 4.6% | |
| 2010 | 5,965,343 | 4.9% | |
| 2020 | 6,245,051 | 4.7% | |
| 2022 (est.) | 6,241,164 | −0.1% | |
As of the 2020 U.S. census, the Philadelphia–Camden–Wilmington metropolitan statistical area is the seventh-largest MSA in the nation with 6,245,051 people. The MSA includes:
- Camden, NJ Metropolitan Division Burlington County, NJ Camden County, NJ Gloucester County, NJ
- Philadelphia, PA Metropolitan Division Bucks County, PA Chester County, PA Delaware County, PA Montgomery County, PA Philadelphia City, PA
- Wilmington, DE-MD-NJ Metropolitan Division Cecil County, MD New Castle County, DE Salem County, NJ
| County | 2021 estimate | 2020 census | Change | Area | Density |
|---|---|---|---|---|---|
| Philadelphia City, PA | 1,576,251 | 1,603,797 | −1.72% | 134.28 sq mi (347.8 km2) | 11,739/sq mi (4,532/km2) |
| Montgomery County, PA | 860,578 | 856,553 | +0.47% | 483 sq mi (1,250 km2) | 1,782/sq mi (688/km2) |
| Bucks County, PA | 646,098 | 646,538 | −0.07% | 604 sq mi (1,560 km2) | 1,070/sq mi (413/km2) |
| Delaware County, PA | 573,849 | 576,830 | −0.52% | 184 sq mi (480 km2) | 3,119/sq mi (1,204/km2) |
| New Castle County, DE | 571,708 | 570,719 | +0.17% | 426 sq mi (1,100 km2) | 1,342/sq mi (518/km2) |
| Chester County, PA | 538,649 | 534,413 | +0.79% | 751 sq mi (1,950 km2) | 717/sq mi (277/km2) |
| Camden County, NJ | 523,771 | 523,485 | +0.05% | 221.26 sq mi (573.1 km2) | 2,367/sq mi (914/km2) |
| Burlington County, NJ | 464,269 | 461,860 | +0.52% | 798.58 sq mi (2,068.3 km2) | 581/sq mi (224/km2) |
| Gloucester County, NJ | 304,477 | 302,294 | +0.72% | 322 sq mi (830 km2) | 946/sq mi (365/km2) |
| Cecil County, MD | 103,725 | 104,870 | −1.09% | 418 sq mi (1,080 km2) | 251/sq mi (97/km2) |
| Salem County, NJ | 65,046 | 64,837 | +0.32% | 331.9 sq mi (860 km2) | 196/sq mi (76/km2) |
| Philadelphia MSA | 6,228,601 | 6,245,051 | −0.26% | 4,602.02 sq mi (11,919.2 km2) | 1,353/sq mi (523/km2) |

Combined statistical area (CSA)
As of 2020, the Philadelphia–Reading–Camden, PA-NJ-DE-MD CSA is the nation's ninth-largest combined statistical area with a population of 7,379,700. Philadelphia-Reading-Camden Combined Statistical Area includes:
- Philadelphia-Camden-Wilmington MSA (11 counties, as defined above)
- Berks County, Pennsylvania, comprising the Reading, PA MSA
- Atlantic County, New Jersey, comprising the Atlantic City-Hammonton, NJ MSA
- Cape May County, New Jersey, comprising the Ocean City, NJ MSA
- Cumberland County, New Jersey, comprising the Vineland-Bridgeton, NJ MSA
- Kent County, Delaware, comprising the Dover, DE MSA
| County | 2021 estimate | 2020 census | Change | Area | Density |
|---|---|---|---|---|---|
| Philadelphia MSA | 6,228,601 | 6,245,051 | −0.26% | 4,602.02 sq mi (11,919.2 km2) | 1,353/sq mi (523/km2) |
| Berks County, PA | 429,342 | 428,849 | +0.11% | 857 sq mi (2,220 km2) | 501/sq mi (193/km2) |
| Atlantic County, NJ | 274,966 | 274,534 | +0.16% | 555.7 sq mi (1,439 km2) | 495/sq mi (191/km2) |
| Kent County, DE | 184,149 | 181,851 | +1.26% | 586 sq mi (1,520 km2) | 314/sq mi (121/km2) |
| Cumberland County, NJ | 153,627 | 154,152 | −0.34% | 483.7 sq mi (1,253 km2) | 318/sq mi (123/km2) |
| Cape May County, NJ | 95,661 | 95,263 | +0.42% | 251.42 sq mi (651.2 km2) | 380/sq mi (147/km2) |
| Philadelphia CSA | 7,366,346 | 7,379,700 | −0.18% | 7,335.84 sq mi (18,999.7 km2) | 1,004/sq mi (388/km2) |
Statistical history
When metropolitan areas were originally defined in 1950, most of this urban area was split between four metropolitan areas, or standard metropolitan areas, as they were then called. The Philadelphia SMA included Philadelphia, Bucks, Chester, Delaware, and Montgomery counties in Pennsylvania, and Burlington, Camden, and Gloucester counties in South Jersey. The Wilmington SMA included New Castle County in Delaware and Salem County in South Jersey. Berks County was designated as the Reading SMA and Atlantic County, New Jersey was the Atlantic City SMA.
In 1960, Cecil County, Maryland was added to what was now the Wilmington Standard Metropolitan Statistical Area (SMSA). In 1980, Cumberland County, New Jersey was defined as the Vineland-Millville-Bridgeton SMSA.
In 1990, the Philadelphia, Wilmington and Vineland-Millville-Bridgeton SMSAs were merged with the Trenton SMSA to form the Philadelphia–Wilmington–Trenton Consolidated Metropolitan Statistical Area. At the same time, Cape May County, New Jersey was added to the Atlantic City SMSA. The "Philadelphia-Wilmington-Trenton" became obsolete one census later when Trenton, New Jersey was moved to the New York-Newark-Bridgeport CSA. The Philadelphia-Wilmington-Vineland CSA included the Philadelphia-Wilmington-Camden MSA and the Vineland-Millville-Bridgeton MSA.
In 2000, Kent County, Delaware was designated the Dover MSA, and Kent County and Atlantic City were added to the Philadelphia CSA in 2010. As a result of new 2010 definitions, based on a threshold of 15% labor interchange between MSAs, two additional MSAs were added, Ocean City, New Jersey and Reading, Pennsylvania. The CSA to which they belong is known as Philadelphia-Reading-Camden.
Climate Types
All of it is Humid Subtropical
- Maryland Köppen Climate Types
- Pennsylvania Köppen Climate Types
- Delaware Köppen Climate Types
- New Jersey Köppen Climate Types
Subregions
The Philadelphia–Reading–Camden combined statistical area includes sixteen counties in four states. The five Pennsylvania counties in the metropolitan statistical area are collectively known as Southeastern Pennsylvania. In addition to Philadelphia, major municipalities in Southeastern Pennsylvania include the inner suburbs of Upper Darby Township and Bensalem Township. Berks County, which forms its own MSA and contains the CSA's second largest city, Reading, is occasionally not considered to be part of Southeastern Pennsylvania and is sometimes assigned to South Central Pennsylvania.
The seven New Jersey counties in the CSA are in South Jersey. Atlantic County, Cape May County, and Cumberland County each form their own respective metropolitan statistical areas. Atlantic City, Cape May County, New Jersey, and the southern Jersey Shore, including Margate City, Ventnor City, the Wildwoods, Northfield, Sea Isle City, are major tourist destinations for people from inside and outside of the metropolitan area. Other major municipalities in South Jersey include Cherry Hill and Camden, which is across the Delaware River, east of Philadelphia. Burlington, Camden, Gloucester, and Salem Counties comprise the Delaware River Region, one of seven officially recognized tourism regions by the New Jersey Department of Tourism.
The two counties of Delaware in the CSA constitute a majority of Delaware's land mass and population. Wilmington is the most populous city in Delaware and the fifth-most populous municipality in the metropolitan Philadelphia. The lone Maryland county in the Philadelphia-Reading-Camden Combined Statistical Area is part of the region known as the Eastern Shore of Maryland.
Ethnically, Indians make up the largest foreign-born population in Greater Philadelphia.
Largest municipalities


The following municipalities are all within the Philadelphia–Reading–Camden combined statistical area as of the 2020 census:
| City | Pop. | County | State |
|---|---|---|---|
| Philadelphia | 1,603,797 | Philadelphia | PA |
| Reading | 95,112 | Berks | PA |
| Upper Darby Township | 85,681 | Delaware | PA |
| Cherry Hill | 74,553 | Camden | NJ |
| Camden | 71,792 | Camden | NJ |
| Wilmington | 70,898 | New Castle | DE |
| Gloucester Township | 66,034 | Camden | NJ |
| Lower Merion Township | 63,633 | Montgomery | PA |
| Bensalem Township | 62,707 | Bucks | PA |
| Vineland | 60,780 | Cumberland | NJ |
| Abington Township | 58,502 | Montgomery | PA |
| Bristol Township | 54,291 | Bucks | PA |
| Haverford Township | 50,437 | Delaware | PA |
| Washington Township | 48,667 | Gloucester | NJ |
| Egg Harbor Township | 47,842 | Atlantic | NJ |
| Evesham Township | 46,826 | Burlington | NJ |
| Middletown Township | 46,040 | Bucks | PA |
| Mount Laurel | 44,633 | Burlington | NJ |
| Northampton Township | 39,915 | Bucks | PA |
| Winslow Township | 39,907 | Camden | NJ |
Climate
The Philadelphia metro area has four distinct seasons with ample precipitation and is divided by the 0 °C (32 °F) January isotherm. Philadelphia and the New Jersey portion of the area, almost all of the Delaware and Maryland portions, most of Delaware County and lower Bucks County, lowland southern Chester County, and some southern and lowland areas of Montgomery County have a humid subtropical climate (Cfa according to the Köppen climate classification.) The remainder of the metro area has a hot summer humid continental climate (Dfa.)
Snow amounts may vary widely year-to-year and normally do vary widely within metro Philadelphia. The region has two ski resorts, Bear Creek Mountain Resort in Longswamp Township, Berks County and Spring Mountain Adventures in central Montgomery County.
Using the -3 °C January isotherm as a boundary, all of the metro area is humid subtropical. The hardiness zone in the region ranges from 6b in higher areas of Berks and northern Bucks Counties to 8a in Atlantic City and Cape May.
Using the Trewartha climate classification system, which requires eight months to average at least 50 °F for the climate to be considered subtropical, the region only has seven such months, so the area considered Cfa by Köppen is oceanic (Do) in the Trewartha system.
| vteClimate data for Philadelphia (Philadelphia Airport), 1991–2020 normals, extremes 1872–present | |||||||||||||
|---|---|---|---|---|---|---|---|---|---|---|---|---|---|
| Month | Jan | Feb | Mar | Apr | May | Jun | Jul | Aug | Sep | Oct | Nov | Dec | Year |
| Record high °F (°C) | 74 (23) | 79 (26) | 87 (31) | 95 (35) | 97 (36) | 102 (39) | 104 (40) | 106 (41) | 102 (39) | 96 (36) | 84 (29) | 73 (23) | 106 (41) |
| Mean maximum °F (°C) | 63.3 (17.4) | 63.5 (17.5) | 73.8 (23.2) | 84.3 (29.1) | 90.2 (32.3) | 94.8 (34.9) | 97.1 (36.2) | 94.8 (34.9) | 90.6 (32.6) | 82.6 (28.1) | 72.4 (22.4) | 64.2 (17.9) | 98.1 (36.7) |
| Mean daily maximum °F (°C) | 41.3 (5.2) | 44.3 (6.8) | 52.8 (11.6) | 64.7 (18.2) | 74.4 (23.6) | 83.2 (28.4) | 87.8 (31.0) | 85.8 (29.9) | 78.9 (26.1) | 67.2 (19.6) | 55.9 (13.3) | 46.0 (7.8) | 65.2 (18.4) |
| Daily mean °F (°C) | 33.7 (0.9) | 35.9 (2.2) | 43.6 (6.4) | 54.5 (12.5) | 64.3 (17.9) | 73.5 (23.1) | 78.7 (25.9) | 76.8 (24.9) | 69.9 (21.1) | 58.2 (14.6) | 47.4 (8.6) | 38.6 (3.7) | 56.3 (13.5) |
| Mean daily minimum °F (°C) | 26.0 (−3.3) | 27.5 (−2.5) | 34.3 (1.3) | 44.3 (6.8) | 54.2 (12.3) | 63.9 (17.7) | 69.6 (20.9) | 67.9 (19.9) | 60.9 (16.1) | 49.2 (9.6) | 38.8 (3.8) | 31.2 (−0.4) | 47.3 (8.5) |
| Mean minimum °F (°C) | 10.7 (−11.8) | 13.7 (−10.2) | 20.8 (−6.2) | 33.0 (0.6) | 43.1 (6.2) | 53.2 (11.8) | 62.2 (16.8) | 60.3 (15.7) | 49.5 (9.7) | 37.1 (2.8) | 26.4 (−3.1) | 19.0 (−7.2) | 8.6 (−13.0) |
| Record low °F (°C) | −7 (−22) | −11 (−24) | 5 (−15) | 14 (−10) | 28 (−2) | 44 (7) | 51 (11) | 44 (7) | 35 (2) | 25 (−4) | 8 (−13) | −5 (−21) | −11 (−24) |
| Average precipitation inches (mm) | 3.13 (80) | 2.75 (70) | 3.96 (101) | 3.47 (88) | 3.34 (85) | 4.04 (103) | 4.38 (111) | 4.29 (109) | 4.40 (112) | 3.47 (88) | 2.91 (74) | 3.97 (101) | 44.11 (1,120) |
| Average snowfall inches (cm) | 7.1 (18) | 8.4 (21) | 3.6 (9.1) | 0.3 (0.76) | 0.0 (0.0) | 0.0 (0.0) | 0.0 (0.0) | 0.0 (0.0) | 0.0 (0.0) | 0.0 (0.0) | 0.2 (0.51) | 3.5 (8.9) | 23.1 (59) |
| Average precipitation days (≥ 0.01 in) | 11.0 | 9.7 | 10.9 | 10.9 | 11.0 | 10.3 | 10.1 | 8.9 | 9.3 | 9.1 | 8.6 | 11.0 | 120.8 |
| Average snowy days (≥ 0.1 in) | 4.1 | 3.8 | 2.0 | 0.2 | 0.0 | 0.0 | 0.0 | 0.0 | 0.0 | 0.0 | 0.1 | 1.8 | 12.0 |
| Average relative humidity (%) | 66.2 | 63.6 | 61.7 | 60.4 | 65.4 | 67.8 | 69.6 | 70.4 | 71.6 | 70.8 | 68.4 | 67.7 | 67.0 |
| Average dew point °F (°C) | 19.8 (−6.8) | 21.0 (−6.1) | 28.6 (−1.9) | 37.0 (2.8) | 49.5 (9.7) | 59.2 (15.1) | 64.6 (18.1) | 63.7 (17.6) | 57.2 (14.0) | 45.7 (7.6) | 35.6 (2.0) | 25.5 (−3.6) | 42.3 (5.7) |
| Mean monthly sunshine hours | 155.7 | 154.7 | 202.8 | 217.0 | 245.1 | 271.2 | 275.6 | 260.1 | 219.3 | 204.5 | 154.7 | 137.7 | 2,498.4 |
| Percentage possible sunshine | 52 | 52 | 55 | 55 | 55 | 61 | 61 | 61 | 59 | 59 | 52 | 47 | 56 |
| Average ultraviolet index | 2 | 3 | 4 | 6 | 8 | 9 | 9 | 8 | 6 | 4 | 2 | 2 | 5 |
| Source 1: NOAA (relative humidity, dew point and sun 1961–1990) | |||||||||||||
| Source 2: Weather Atlas (UV index) |
| Climate data for Philadelphia | |||||||||||||
|---|---|---|---|---|---|---|---|---|---|---|---|---|---|
| Month | Jan | Feb | Mar | Apr | May | Jun | Jul | Aug | Sep | Oct | Nov | Dec | Year |
| Average sea temperature °F (°C) | 41.8 (5.5) | 39.9 (4.4) | 41.2 (5.1) | 46.7 (8.2) | 53.9 (12.2) | 66.3 (19.0) | 74.0 (23.3) | 75.9 (24.4) | 71.4 (21.9) | 64.2 (17.9) | 55.1 (12.8) | 47.7 (8.8) | 56.5 (13.6) |
| Mean daily daylight hours | 10.0 | 11.0 | 12.0 | 13.0 | 14.0 | 15.0 | 15.0 | 14.0 | 12.0 | 11.0 | 10.0 | 9.0 | 12.2 |
| Source: Weather Atlas |
| Climate data for Atlantic City International Airport, 1991–2020 normals, extremes 1874–present | |||||||||||||
|---|---|---|---|---|---|---|---|---|---|---|---|---|---|
| Month | Jan | Feb | Mar | Apr | May | Jun | Jul | Aug | Sep | Oct | Nov | Dec | Year |
| Record high °F (°C) | 78 (26) | 76 (24) | 87 (31) | 94 (34) | 99 (37) | 106 (41) | 105 (41) | 103 (39) | 99 (37) | 96 (36) | 84 (29) | 77 (25) | 106 (41) |
| Mean maximum °F (°C) | 63.5 (17.5) | 64.8 (18.2) | 73.2 (22.9) | 83.2 (28.4) | 89.3 (31.8) | 94.5 (34.7) | 96.9 (36.1) | 94.6 (34.8) | 90.1 (32.3) | 82.8 (28.2) | 72.7 (22.6) | 65.3 (18.5) | 98.1 (36.7) |
| Mean daily maximum °F (°C) | 43.2 (6.2) | 45.8 (7.7) | 52.6 (11.4) | 63.3 (17.4) | 72.5 (22.5) | 81.5 (27.5) | 86.6 (30.3) | 84.8 (29.3) | 78.5 (25.8) | 67.7 (19.8) | 57.1 (13.9) | 48.1 (8.9) | 65.1 (18.4) |
| Daily mean °F (°C) | 34.1 (1.2) | 36.0 (2.2) | 42.6 (5.9) | 52.5 (11.4) | 61.9 (16.6) | 71.4 (21.9) | 76.9 (24.9) | 75.0 (23.9) | 68.4 (20.2) | 57.1 (13.9) | 46.8 (8.2) | 38.7 (3.7) | 55.1 (12.8) |
| Mean daily minimum °F (°C) | 25.1 (−3.8) | 26.2 (−3.2) | 32.6 (0.3) | 41.7 (5.4) | 51.4 (10.8) | 61.3 (16.3) | 67.2 (19.6) | 65.2 (18.4) | 58.2 (14.6) | 46.4 (8.0) | 36.6 (2.6) | 29.4 (−1.4) | 45.1 (7.3) |
| Mean minimum °F (°C) | 6.5 (−14.2) | 9.7 (−12.4) | 16.1 (−8.8) | 26.7 (−2.9) | 36.0 (2.2) | 46.2 (7.9) | 55.9 (13.3) | 53.8 (12.1) | 43.5 (6.4) | 31.0 (−0.6) | 20.4 (−6.4) | 14.0 (−10.0) | 4.4 (−15.3) |
| Record low °F (°C) | −10 (−23) | −11 (−24) | 2 (−17) | 12 (−11) | 25 (−4) | 37 (3) | 42 (6) | 40 (4) | 32 (0) | 20 (−7) | 10 (−12) | −7 (−22) | −11 (−24) |
| Average precipitation inches (mm) | 3.38 (86) | 3.23 (82) | 4.52 (115) | 3.32 (84) | 3.34 (85) | 3.58 (91) | 4.47 (114) | 4.59 (117) | 3.55 (90) | 4.14 (105) | 3.37 (86) | 4.47 (114) | 45.96 (1,167) |
| Average snowfall inches (cm) | 5.7 (14) | 5.9 (15) | 2.2 (5.6) | 0.3 (0.76) | 0.0 (0.0) | 0.0 (0.0) | 0.0 (0.0) | 0.0 (0.0) | 0.0 (0.0) | 0.0 (0.0) | 0.1 (0.25) | 3.2 (8.1) | 17.4 (44) |
| Average extreme snow depth inches (cm) | 3.6 (9.1) | 3.1 (7.9) | 1.3 (3.3) | 0.1 (0.25) | 0.0 (0.0) | 0.0 (0.0) | 0.0 (0.0) | 0.0 (0.0) | 0.0 (0.0) | 0.0 (0.0) | 0.0 (0.0) | 1.9 (4.8) | 6.0 (15) |
| Average precipitation days (≥ 0.01 in) | 10.8 | 10.4 | 10.9 | 11.4 | 10.5 | 9.9 | 9.9 | 9.2 | 8.5 | 8.9 | 8.9 | 10.8 | 120.1 |
| Average snowy days (≥ 0.1 in) | 3.0 | 3.2 | 1.2 | 0.1 | 0.0 | 0.0 | 0.0 | 0.0 | 0.0 | 0.0 | 0.0 | 1.4 | 8.9 |
| Average relative humidity (%) | 69.5 | 69.0 | 66.9 | 66.4 | 70.7 | 72.9 | 73.9 | 75.7 | 76.4 | 74.8 | 72.8 | 70.6 | 71.6 |
| Average dew point °F (°C) | 21.6 (−5.8) | 23.2 (−4.9) | 30.0 (−1.1) | 37.9 (3.3) | 49.5 (9.7) | 59.4 (15.2) | 64.8 (18.2) | 64.2 (17.9) | 57.7 (14.3) | 46.4 (8.0) | 37.0 (2.8) | 27.0 (−2.8) | 43.2 (6.2) |
| Mean monthly sunshine hours | 150.8 | 157.9 | 204.5 | 218.9 | 243.9 | 266.2 | 276.3 | 271.3 | 227.6 | 200.5 | 147.4 | 133.8 | 2,499.1 |
| Percentage possible sunshine | 50 | 53 | 55 | 55 | 55 | 60 | 61 | 64 | 61 | 58 | 49 | 46 | 56 |
| Average ultraviolet index | 1.6 | 2.6 | 4.2 | 6.0 | 7.5 | 8.5 | 8.6 | 7.7 | 6.0 | 3.8 | 2.1 | 1.5 | 5.0 |
| Source 1: NOAA (relative humidity, dew point and sun 1961–1990) | |||||||||||||
| Source 2: UV Index Today (1995 to 2022) |
| Climate data for Doylestown, Pennsylvania | |||||||||||||
|---|---|---|---|---|---|---|---|---|---|---|---|---|---|
| Month | Jan | Feb | Mar | Apr | May | Jun | Jul | Aug | Sep | Oct | Nov | Dec | Year |
| Mean daily maximum °F (°C) | 39 (4) | 43 (6) | 52 (11) | 63 (17) | 74 (23) | 82 (28) | 87 (31) | 85 (29) | 77 (25) | 66 (19) | 55 (13) | 44 (7) | 64 (18) |
| Mean daily minimum °F (°C) | 24 (−4) | 25 (−4) | 33 (1) | 42 (6) | 52 (11) | 61 (16) | 66 (19) | 65 (18) | 57 (14) | 45 (7) | 37 (3) | 29 (−2) | 45 (7) |
| Average precipitation inches (mm) | 3.94 (100) | 2.87 (73) | 4.24 (108) | 3.85 (98) | 4.81 (122) | 3.61 (92) | 4.72 (120) | 4.34 (110) | 4.66 (118) | 3.35 (85) | 3.74 (95) | 3.80 (97) | 47.93 (1,217) |
| Source: Weather Channel |
| Climate data for Reading, PA (Reading Regional Airport) 1991–2020 normals, extremes 1888–present | |||||||||||||
|---|---|---|---|---|---|---|---|---|---|---|---|---|---|
| Month | Jan | Feb | Mar | Apr | May | Jun | Jul | Aug | Sep | Oct | Nov | Dec | Year |
| Record high °F (°C) | 77 (25) | 82 (28) | 88 (31) | 97 (36) | 96 (36) | 102 (39) | 106 (41) | 105 (41) | 102 (39) | 94 (34) | 84 (29) | 77 (25) | 106 (41) |
| Mean daily maximum °F (°C) | 38.6 (3.7) | 41.9 (5.5) | 51.0 (10.6) | 63.4 (17.4) | 73.5 (23.1) | 82.0 (27.8) | 86.5 (30.3) | 84.4 (29.1) | 77.1 (25.1) | 65.4 (18.6) | 53.8 (12.1) | 43.4 (6.3) | 63.4 (17.4) |
| Daily mean °F (°C) | 30.8 (−0.7) | 33.1 (0.6) | 41.5 (5.3) | 52.5 (11.4) | 62.5 (16.9) | 71.6 (22.0) | 76.1 (24.5) | 74.3 (23.5) | 66.9 (19.4) | 55.2 (12.9) | 44.6 (7.0) | 35.7 (2.1) | 53.7 (12.1) |
| Mean daily minimum °F (°C) | 23.0 (−5.0) | 24.4 (−4.2) | 31.9 (−0.1) | 41.7 (5.4) | 51.5 (10.8) | 61.2 (16.2) | 65.8 (18.8) | 64.1 (17.8) | 56.6 (13.7) | 45.0 (7.2) | 35.4 (1.9) | 28.0 (−2.2) | 44.1 (6.7) |
| Record low °F (°C) | −20 (−29) | −13 (−25) | −2 (−19) | 12 (−11) | 26 (−3) | 36 (2) | 43 (6) | 39 (4) | 30 (−1) | 20 (−7) | 8 (−13) | −6 (−21) | −20 (−29) |
| Average precipitation inches (mm) | 2.97 (75) | 2.61 (66) | 3.53 (90) | 3.35 (85) | 3.51 (89) | 4.77 (121) | 4.77 (121) | 4.49 (114) | 4.88 (124) | 3.80 (97) | 3.02 (77) | 3.51 (89) | 45.21 (1,148) |
| Average precipitation days (≥ 0.01 in) | 10.3 | 10.2 | 10.7 | 11.6 | 12.5 | 12.4 | 10.7 | 11.2 | 9.1 | 10.1 | 8.9 | 10.8 | 128.5 |
| Source: NOAA |
| Climate data for Dover, Delaware (1991−2020 normals, extremes 1893–present) | |||||||||||||
|---|---|---|---|---|---|---|---|---|---|---|---|---|---|
| Month | Jan | Feb | Mar | Apr | May | Jun | Jul | Aug | Sep | Oct | Nov | Dec | Year |
| Record high °F (°C) | 77 (25) | 80 (27) | 88 (31) | 97 (36) | 98 (37) | 101 (38) | 104 (40) | 102 (39) | 99 (37) | 95 (35) | 85 (29) | 75 (24) | 104 (40) |
| Mean maximum °F (°C) | 66 (19) | 65 (18) | 73 (23) | 83 (28) | 88 (31) | 93 (34) | 95 (35) | 93 (34) | 89 (32) | 83 (28) | 74 (23) | 66 (19) | 96 (36) |
| Mean daily maximum °F (°C) | 44.4 (6.9) | 47.4 (8.6) | 54.5 (12.5) | 66.0 (18.9) | 74.4 (23.6) | 82.7 (28.2) | 86.9 (30.5) | 85.1 (29.5) | 79.2 (26.2) | 68.9 (20.5) | 58.0 (14.4) | 48.6 (9.2) | 66.3 (19.1) |
| Daily mean °F (°C) | 36.0 (2.2) | 38.2 (3.4) | 45.0 (7.2) | 55.5 (13.1) | 64.4 (18.0) | 73.2 (22.9) | 77.9 (25.5) | 76.2 (24.6) | 70.1 (21.2) | 59.2 (15.1) | 48.7 (9.3) | 40.3 (4.6) | 57.1 (13.9) |
| Mean daily minimum °F (°C) | 27.6 (−2.4) | 29.0 (−1.7) | 35.4 (1.9) | 44.9 (7.2) | 54.4 (12.4) | 63.8 (17.7) | 69.0 (20.6) | 67.3 (19.6) | 61.0 (16.1) | 49.5 (9.7) | 39.3 (4.1) | 32.1 (0.1) | 47.8 (8.8) |
| Mean minimum °F (°C) | 11 (−12) | 13 (−11) | 20 (−7) | 31 (−1) | 41 (5) | 51 (11) | 59 (15) | 58 (14) | 48 (9) | 34 (1) | 24 (−4) | 18 (−8) | 9 (−13) |
| Record low °F (°C) | −7 (−22) | −11 (−24) | 7 (−14) | 14 (−10) | 28 (−2) | 41 (5) | 45 (7) | 35 (2) | 30 (−1) | 25 (−4) | 11 (−12) | −3 (−19) | −11 (−24) |
| Average precipitation inches (mm) | 3.43 (87) | 3.08 (78) | 4.21 (107) | 3.72 (94) | 3.89 (99) | 4.56 (116) | 4.14 (105) | 4.92 (125) | 4.25 (108) | 4.06 (103) | 3.36 (85) | 3.99 (101) | 47.61 (1,209) |
| Average snowfall inches (cm) | 4.1 (10) | 5.9 (15) | 0.6 (1.5) | 0.0 (0.0) | 0.0 (0.0) | 0.0 (0.0) | 0.0 (0.0) | 0.0 (0.0) | 0.0 (0.0) | 0.0 (0.0) | 0.0 (0.0) | 2.6 (6.6) | 13.2 (34) |
| Average precipitation days (≥ 0.01 in) | 9.7 | 9.2 | 9.8 | 10.3 | 10.5 | 9.2 | 9.0 | 8.2 | 8.2 | 8.0 | 7.4 | 10.2 | 109.7 |
| Average snowy days (≥ 0.1 in) | 1.8 | 1.9 | 0.4 | 0.0 | 0.0 | 0.0 | 0.0 | 0.0 | 0.0 | 0.0 | 0.0 | 0.8 | 4.9 |
| Average ultraviolet index | 2 | 3 | 5 | 6 | 8 | 9 | 9 | 8 | 7 | 4 | 2 | 2 | 5 |
| Source 1: NOAA | |||||||||||||
| Source 2: Weather Atlas (UV) |
| Climate data for Wilmington, Delaware (New Castle County Airport), 1991–2020 normals, extremes 1894–present | |||||||||||||
|---|---|---|---|---|---|---|---|---|---|---|---|---|---|
| Month | Jan | Feb | Mar | Apr | May | Jun | Jul | Aug | Sep | Oct | Nov | Dec | Year |
| Record high °F (°C) | 75 (24) | 78 (26) | 86 (30) | 97 (36) | 98 (37) | 102 (39) | 103 (39) | 107 (42) | 100 (38) | 98 (37) | 85 (29) | 75 (24) | 107 (42) |
| Mean maximum °F (°C) | 63 (17) | 64 (18) | 74 (23) | 83 (28) | 89 (32) | 93 (34) | 96 (36) | 94 (34) | 90 (32) | 83 (28) | 72 (22) | 64 (18) | 97 (36) |
| Mean daily maximum °F (°C) | 41.4 (5.2) | 44.1 (6.7) | 52.5 (11.4) | 64.2 (17.9) | 73.5 (23.1) | 82.2 (27.9) | 86.8 (30.4) | 84.9 (29.4) | 78.5 (25.8) | 67.0 (19.4) | 55.9 (13.3) | 46.0 (7.8) | 64.8 (18.2) |
| Daily mean °F (°C) | 33.5 (0.8) | 35.5 (1.9) | 43.2 (6.2) | 53.9 (12.2) | 63.5 (17.5) | 72.6 (22.6) | 77.6 (25.3) | 75.8 (24.3) | 68.9 (20.5) | 57.2 (14.0) | 46.6 (8.1) | 38.2 (3.4) | 55.5 (13.1) |
| Mean daily minimum °F (°C) | 25.6 (−3.6) | 27.0 (−2.8) | 33.9 (1.1) | 43.5 (6.4) | 53.4 (11.9) | 63.0 (17.2) | 68.3 (20.2) | 66.6 (19.2) | 59.3 (15.2) | 47.3 (8.5) | 37.4 (3.0) | 30.3 (−0.9) | 46.3 (7.9) |
| Mean minimum °F (°C) | 10 (−12) | 12 (−11) | 19 (−7) | 30 (−1) | 39 (4) | 50 (10) | 58 (14) | 56 (13) | 45 (7) | 33 (1) | 23 (−5) | 16 (−9) | 7 (−14) |
| Record low °F (°C) | −14 (−26) | −15 (−26) | 2 (−17) | 11 (−12) | 30 (−1) | 40 (4) | 48 (9) | 43 (6) | 32 (0) | 23 (−5) | 11 (−12) | −7 (−22) | −15 (−26) |
| Average precipitation inches (mm) | 3.23 (82) | 2.83 (72) | 4.16 (106) | 3.51 (89) | 3.57 (91) | 4.67 (119) | 4.41 (112) | 3.98 (101) | 4.38 (111) | 3.68 (93) | 3.06 (78) | 3.85 (98) | 45.33 (1,151) |
| Average snowfall inches (cm) | 6.1 (15) | 7.8 (20) | 3.1 (7.9) | 0.1 (0.25) | 0.0 (0.0) | 0.0 (0.0) | 0.0 (0.0) | 0.0 (0.0) | 0.0 (0.0) | 0.0 (0.0) | 0.2 (0.51) | 2.9 (7.4) | 20.2 (51) |
| Average precipitation days (≥ 0.01 in) | 10.8 | 10.0 | 11.2 | 11.1 | 11.7 | 11.0 | 10.0 | 8.9 | 8.8 | 8.9 | 8.8 | 10.6 | 121.8 |
| Average snowy days (≥ 0.1 in) | 3.5 | 3.5 | 1.7 | 0.1 | 0.0 | 0.0 | 0.0 | 0.0 | 0.0 | 0.0 | 0.2 | 1.7 | 10.7 |
| Source: NOAA |
Economy
As of 2021, the Philadelphia–Camden–Wilmington Metropolitan Statistical Area has a gross domestic product of $477.58 billion, the tenth-largest among the nation's MSAs. The MSA's nominal gross domestic product of $431 billion is comparable to countries, such as Belgium, Iran, and Thailand. Metropolitan Philadelphia is one of the top five American venture capital hubs, credited to its proximity to the New York metropolitan area and its financial and tech and biotechnology ecosystems.
At least two educational institutions, Delaware Valley Regional High School in Alexandria Township, New Jersey, and Delaware Valley College in Doylestown Township, Pennsylvania, and a now defunct local newspaper, The Delaware Valley News in Frenchtown, New Jersey, are named for the region.
Delaware Regional Planning Commission
The Delaware Valley Regional Planning Commission (DVRPC) serves all of the counties of the Philadelphia MSA except for the counties in the Wilmington, DE-MD-NJ Metropolitan Division. However, in addition to the metropolitan area, DVRPC's jurisdiction includes Mercer County, New Jersey, which OMB classifies as the Trenton-Princeton, NJ MSA and part of the larger New York-Newark CSA.
Colonial history
The valley was the territory of the Susquehannock and Lenape, who are recalled in place names throughout the region. The region became part of the Dutch colony of New Netherland after the exploration of Delaware Bay in 1609. The Dutch called the Delaware River the Zuyd Rivier, or South River, and considered the lands along it banks and those of its bay to be the southern flank of its province of New Netherland. In 1638, it began to be settled by Swedes, Forest Finns, Dutch, and Walloons and became the colony of New Sweden, though this was not officially recognized by the Dutch Empire which re-asserted control in 1655. The area was taken by the English in 1664. The name Delaware comes from Thomas West, 3rd Baron De La Warr, who had arrived at Jamestown, Virginia in 1610, just as original settlers were about to abandon it, and thus maintaining the English foothold on the North American continent. In the early 1700s, Huguenot refugees from France by way of Germany and then England began settling in the Delaware River Valley. Specifically, they left their mark in Hunterdon County, New Jersey (Frenchtown) and Bethlehem, Pennsylvania.
Transportation
Many residents commute to jobs and travel in Philadelphia, Camden, Wilmington, and the surrounding suburbs with the help of expressways, trains, and buses. There are currently no transit connections to Reading, the second largest municipality in the region.
Rail
Rapid transit

- SEPTA B line connecting Fern Rock Transportation Center in North Philadelphia to Center City and NRG station in South Philadelphia L line connecting 69th Street Transportation Center in Upper Darby to Frankford Transportation Center in Near Northeast Philadelphia, passing through Center City M line connecting 69th Street Transportation Center with Norristown Transportation Center in Norristown
- PATCO PATCO Speedline connecting Philadelphia to Lindenwold, NJ in Camden County with connections to NJT's Atlantic City Line.
Light rail
- SEPTA Subway–surface lines: Routes 10, 11, 13, 34, and 36, connecting West Philadelphia and Delaware County with 13th Street Station, running at street-level through Delaware County and West Philadelphia, and beneath Market Street in Center City Route 15 along Girard Avenue from 63rd Street and Girard Avenue to Richmond and Westmoreland Streets Media–Sharon Hill Line connecting Media (Route 101) and Sharon Hill (Route 102) in Delaware County with 69th Street Transportation Center
- NJ Transit River Line connecting Camden, New Jersey to Trenton, New Jersey, running along the east bank of the Delaware River.
Commuter rail

- SEPTA Regional Rail Airport Line connecting Central Philadelphia with Philadelphia International Airport in Philadelphia and Delaware Counties. Wilmington/Newark Line connecting Philadelphia to the Wilmington, Delaware area (with limited weekday service to Newark, Delaware), via Chester City and Delaware County. Warminster Line connecting Philadelphia with southeastern Montgomery County and Warminster in Bucks County. West Trenton Line connecting Philadelphia north to the Trenton, New Jersey area, serving Montgomery and Bucks County, Pennsylvania, between Jenkintown and Yardley, Pennsylvania, with the final stop in Ewing, New Jersey. Media/Wawa Line connecting Philadelphia to central Delaware County. Paoli/Thorndale Line connecting Philadelphia with the affluent Main Line area and western Chester County near Coatesville. Lansdale/Doylestown Line connecting Philadelphia with Lansdale in central Montgomery County and Doylestown in Bucks County. Manayunk/Norristown Line connecting Philadelphia with Conshohocken and Norristown in Montgomery County. Cynwyd Line connecting Philadelphia with Bala Cynwyd on the Philadelphia/Montgomery County line (limited weekday service) Trenton Line connecting Philadelphia to Trenton, New Jersey, serving Bucks County. Fox Chase Line connecting Central Philadelphia with the Fox Chase area in Philadelphia. Chestnut Hill East Line and Chestnut Hill West Line connecting Central Philadelphia with the Chestnut Hill area of the city.
- NJ Transit Atlantic City Line connecting Philadelphia to Atlantic City, New Jersey with connections to PATCO Speedline in Lindenwold, New Jersey.
- MARC Train Penn Line connecting Perryville, Maryland to Baltimore and Washington D.C., and in the future will connect to SEPTA at Newark, DE.
Intercity rail
- Amtrak Acela: high-speed rail connecting Washington, D.C., with Boston Cardinal connecting Chicago with New York City Carolinian connecting Charlotte, NC with New York City Crescent connecting New Orleans and New York City Keystone Service connecting Harrisburg, PA with New York City Northeast Regional: inter-city regional rail service from Virginia to Boston Palmetto connecting Savannah, GA with New York City Pennsylvanian connecting Pittsburgh with New York City Silver Meteor connecting Miami with New York City Silver Star connecting Miami with New York City Vermonter connecting Washington, D.C., with St. Albans, VT
Bus service
Transit buses
- SEPTA
- NJ Transit
- South Jersey Transportation Authority
- DART First State
- Krapf Transit
- Bucks County Transport
- Transportation Management Association of Chester County
- TMA Bucks
- Pottstown Area Rapid Transit
- Berks Area Regional Transportation Authority
- Cecil Transit
- Atlantic City casino bus routes by a number of private carriers
Intercity bus
- Amtrak Thruway
- BoltBus
- Greyhound Lines
- Klein Transportation
- Martz Trailways
- Megabus
- OurBus
- Peter Pan Bus Lines
- Trans-Bridge Lines
Major highways
Pennsylvania
- PA 41
- PA 52
- PA 61
- PA 63
- PA 73
- PA 82
- PA 100
- PA 113
- PA 132
- PA 152
- PA 162
- PA 179
- PA 212
- PA 213
- PA 232
- PA 252
- PA 261
- PA 263
- PA 272
- PA 282
- PA 291
- PA 309
- PA 313
- PA 320
- PA 332
- PA 340
- PA 345
- PA 352
- PA 363
- PA 372
- PA 401
- PA 412
- PA 413
- PA 420
- PA 452
- PA 463
- PA 472
- PA 491
- PA 513
- PA 532
- PA 562
- PA 563
- PA 611
- PA 663
- PA 724
- PA 796
- PA 841
- PA 842
- PA 896
- PA 926
New Jersey
- US 9
- US 30
- US 40
- US 130
- US 206
- US 322
- Route 27
- Route 29
- Route 31
- Route 33
- Route 38
- Route 42
- Route 44
- Route 45
- Route 47
- Route 48
- Route 49
- Route 50
- Route 52
- Route 54
- Route 55
- Route 56
- Route 68
- Route 70
- Route 72
- Route 73
- Route 83
- Route 87
- Route 90
- Route 109
- Route 129
- Route 133
- Route 143
- Route 147
- Route 152
- Route 156
- Route 157
- Route 168
- Route 179
- Route 413
Delaware
- DE 1
- DE 2
- DE 3
- DE 4
- DE 7
- DE 9
- DE 37
- DE 41
- DE 48
- DE 52
- DE 58
- DE 62
- DE 71
- DE 72
- DE 82
- DE 92
- DE 100
- DE 141
- DE 202
- DE 261
- DE 273
- DE 279
- DE 299
- DE 491
- DE 896
Maryland
- MD 7
- MD 213
- MD 222
- MD 267
- MD 272
- MD 273
- MD 274
- MD 275
- MD 276
- MD 277
- MD 279
- MD 281
- MD 282
- MD 284
- MD 285
- MD 286
- MD 310
- MD 316
- MD 342
- MD 537
- MD 545
- MD 781
- MD 824
- MD 896
Delaware River Bridges


- New Hope–Lambertville Toll Bridge
- New Hope–Lambertville Bridge
- Washington Crossing Bridge
- Calhoun Street Bridge
- Scudder Falls Bridge
- Lower Trenton Bridge
- Trenton–Morrisville Toll Bridge
- Delaware River–Turnpike Toll Bridge
- Burlington–Bristol Bridge
- Tacony–Palmyra Bridge
- Betsy Ross Bridge
- Ben Franklin Bridge
- Walt Whitman Bridge
- Commodore Barry Bridge
- Delaware Memorial Bridge
Airports
Major:
- Philadelphia International Airport (PHL), located 15 miles southwest of Philadelphia, is the main international airport serving the emtropolitan area
- Newark Liberty International Airport (EWR), while not in the Philadelphia Metro Area, is a major airport serving certain regions of the area, including Bucks and Montgomery counties in southeastern Pennsylvania, Philadelphia, and New Jersey.
Secondary:
- Atlantic City International Airport (ACY)
- Lehigh Valley International Airport (ABE) (not in CSA)
- New Castle Airport (ILG)
- Northeast Philadelphia Airport (PNE)
- Reading Regional Airport (RDG)
- Trenton–Mercer Airport (TTN) (not in CSA)
Ferry
The Cape May–Lewes Ferry crosses the mouth of the Delaware Bay between Cape May County, New Jersey and Sussex County, Delaware; US 9 uses this ferry.
The RiverLink Ferry operates hourly ferry service over the Delaware River between the Camden Waterfront and Penn's Landing in Philadelphia. They also operate a special event service for concerts at Freedom Mortgage Pavilion in Camden.
Colleges and universities

Delaware
- Delaware College of Art and Design
- Delaware State University
- Goldey–Beacom College
- University of Delaware
- Wesley College
- Widener University School of Law
- Wilmington University
Maryland
New Jersey
- Rider University
- Rowan University
- Rutgers School of Law–Camden
- Rutgers University (Camden)
- Stockton University
- The College of New Jersey
Pennsylvania
- Albright College
- Alvernia University
- Arcadia University
- Bryn Mawr College
- Cairn University
- Chestnut Hill College
- Cheyney University of Pennsylvania
- Curtis Institute of Music
- Delaware Valley University
- DeVry University
- Drexel University
- Eastern University
- Gwynedd-Mercy College
- Harcum College
- Haverford College
- Holy Family University
- Immaculata University
- Kutztown University of Pennsylvania
- La Salle University
- Lincoln University
- Manor College
- Moore College of Art and Design
- Neumann University
- Peirce College
- Penn State Abington
- Penn State Berks
- Penn State Brandywine
- Penn State Great Valley
- Philadelphia College of Osteopathic Medicine
- Point Park University
- Rosemont College
- Saint Joseph's University
- Swarthmore College
- Temple University
- Thomas Jefferson University
- University of Pennsylvania
- University of the Arts (Philadelphia)
- University of the Sciences in Philadelphia
- University of Valley Forge
- Ursinus College
- Valley Forge Military Academy and College
- Villanova University
- West Chester University
- Westminster Theological Seminary
- Widener University
Culture
Characteristics

Philadelphia's suburbs contain a high concentration of malls, the two largest of which have at least 5,000,000 square feet (460,000 m2) of office space, and at least 600,000 square feet (56,000 m2) of retail. These are the King of Prussia mall in King of Prussia, Pennsylvania, which is the largest in the U.S. (leasable sq. feet of retail space), and the Cherry Hill Mall in Cherry Hill, New Jersey, which was the first enclosed mall on the East Coast. In addition, the Christiana Mall in Newark, Delaware, is a popular destination due to its proximity to Interstate 95 and because of the availability of tax-free shopping in Delaware. Malls, office complexes, strip shopping plazas, expressways, and tract housing are common sights, and more and more continue to replace rolling countryside, farms, woods, and wetlands. However, due to strong opposition by residents and political officials, many acres of land have been preserved throughout the metro area. Older townships and large boroughs, such as Cheltenham, Norristown, Jenkintown, Upper Darby, and West Chester retain distinct community identities while engulfed in suburbia.
Mid-Atlantic American English and its subset, Philadelphia English, are two common dialects of American English in the Philadelphia area.

Sports teams
Listing of the professional sports teams in the Philadelphia metro area:
- National Basketball Association (NBA) Philadelphia 76ers
- Major League Baseball (MLB) Philadelphia Phillies
- Minor League Baseball (MiLB) Jersey Shore BlueClaws Reading Fightin Phils Wilmington Blue Rocks
- National Football League (NFL) Philadelphia Eagles
- National Hockey League (NHL) Philadelphia Flyers
- Major League Soccer (MLS) Philadelphia Union
- NBA G League Delaware Blue Coats
- National Lacrosse League (NLL) Philadelphia Wings
Media
The Philadelphia metro area has several urban areas that border on it, including the Lehigh Valley, and are part of the Philadelphia media market, the fourth-largest media market in the nation as of 2023.
The two main newspapers are The Philadelphia Inquirer and the Philadelphia Daily News, owned by the Philadelphia Media Network. Local television channels include KYW-TV 3 (CBS), WPVI 6 (ABC), WCAU 10 (NBC), WHYY-TV 12 (PBS), WPHL-TV 17 (MyNetworkTV), WTXF 29 (FOX), WPSG 57 (CW), and WPPX 61 (Ion). Radio stations serving the area include: WRTI, WIOQ, WDAS (AM), and WTEL.
Area codes
- 215/267/445: The City of Philadelphia and some of its northern suburbs
- 610/484/835: Southeastern Pennsylvania outside Philadelphia, including the western suburbs, the Lehigh Valley, and most of Berks County
- 856: Southwestern New Jersey, including Camden, Cherry Hill, and Vineland
- 609/640: Central and Southeastern New Jersey, including Trenton, Atlantic City and the southern Jersey Shore
- 302: Delaware
- 410/443/667: Eastern half of Maryland, including Cecil County
- 717/223: South Central Pennsylvania, including Western Berks County
Politics
The city of Philadelphia is heavily Democratic, having voted for the Democratic candidate in every presidential election since 1936. The surrounding suburban counties are key political areas in Pennsylvania, which itself is an important swing state in federal politics. South Jersey has consistently voted Democratic at the presidential level in recent years, although the region is slightly more Republican-leaning than North Jersey and has voted for Republicans at the state and local level. New Castle County's Democratic lean and large share of Delaware's population has tended to make Delaware as a whole vote for Democrats, while the less populous Kent County is more competitive. Cecil County in Maryland has been reliably Republican, voting for the party's candidate in all but two presidential elections since 1952. Recent well-known political figures from the Philadelphia area include former U.S. President Joe Biden, current Pennsylvania governor Josh Shapiro, former Pennsylvania governor Ed Rendell, and the late U.S. Senator Arlen Specter.
| Year | Democratic | Republican | Third parties |
|---|---|---|---|
| 2024 | 62.2% 1,558,902 | 36.7% 918,668 | 1.1% 26,749 |
| 2020 | 64.5% 1,610,595 | 34.6% 862,827 | 0.9% 23,665 |
| 2016 | 62.8% 1,404,688 | 34.0% 759,247 | 3.2% 72,179 |
| 2012 | 63.9% 1,361,797 | 35.1% 747,822 | 1.0% 21,781 |
| 2008 | 65.3% 1,442,154 | 33.7% 743,228 | 1.0% 21,905 |
| 2004 | 61.5% 1,276,306 | 38.0% 787,892 | 0.4% 9,123 |
| 2000 | 60.0% 1,036,313 | 37.4% 645,452 | 2.7% 45,917 |

Congressional districts
The following congressional districts of the United States House of Representatives are located partly or entirely in the Phladelphia combined statistical area. Italicized counties are not part of the CSA.
| District | Incumbent | |||
|---|---|---|---|---|
| District | PVI | Incumbent | Party | Counties |
| DE-AL | D+6 | Sarah McBride | D | Kent, New Castle, and Sussex |
| MD-1 | R+14 | Andy Harris | R | Baltimore, Caroline, Carroll, Cecil, Dorchester, Harford, Kent, Queen Anne's, Somerset, Talbot, Wicomico, and Worcester |
| NJ-1 | D+13 | Donald Norcross | D | Burlington, Camden, and Gloucester |
| NJ-2 | R+1 | Jeff Van Drew | R | Atlantic, Burlington, Camden, Cape May, Cumberland, Gloucester, Ocean, and Salem |
| NJ-3 | R+2 | Herb Conaway | D | Burlington and Ocean |
| PA-1 | R+1 | Brian Fitzpatrick | R | Bucks and Montgomery |
| PA-2 | D+25 | Brendan Boyle | D | Philadelphia |
| PA-3 | D+41 | Dwight Evans | D | Philadelphia |
| PA-4 | D+7 | Madeleine Dean | D | Berks and Montgomery |
| PA-5 | D+13 | Mary Gay Scanlon | D | Delaware, Montgomery, and Philadelphia |
| PA-6 | D+2 | Chrissy Houlahan | D | Berks and Chester |
| PA-9 | R+14 | Dan Meuser | R | Berks, Carbon, Columbia, Lebanon, Luzerne, Montour, Northumberland, and Schuylkill |
Additionally, the Philadelphia metro area is represented in the United States Senate by the eight Senators from Delaware, Maryland, New Jersey, and Pennsylvania.
See also
Notes
Further reading
- Jean R. Soderlund, Lenape Country: Delaware Valley Society before William Penn. Philadelphia: University of Pennsylvania Press, 2014.
- Mark L. Thompson, The Contest for the Delaware Valley: Allegiance, Identity, and Empire in the Seventeenth Century. Baton Rouge, LA: Louisiana State University Press, 2013.
External links
39°52′37″N 75°19′23″W/39.877°N 75.323°W/ 39.877; -75.323