Verification and counting began as soon as the polls closed on 23 June from 22:00 BST onwards (making it the first UK-wide referendum to be counted overnight) and took nine hours and twenty minutes to complete. The early results showed at different times narrow leads for both Remain and Leave; however, Leave took the lead in the national vote count for the final time at 02:58 BST when Castle Point declared its result. The result of the referendum was forecast by the BBC just before 04:40 BST (around 6 hours 40 minutes after polls closed), with around 308 results declared at the time. The first result announced was Gibraltar, and the last was Cornwall.
On 24 June 2016, the recorded result was that the UK voted to leave the European Union by 51.89% for Leave to 48.11% for Remain, a margin of 3.78%. This corresponded to 17,410,742 votes to leave and 16,141,241 to remain, a margin of 1,269,501 votes.
United Kingdom
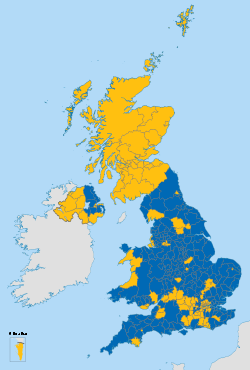
Of the 382 voting areas in Great Britain and Gibraltar and the 18 Northern Ireland parliamentary constituencies, a total of 270 returned "majority" votes in favour of "Leave the European Union", while 129 returned "majority" votes in favour of "Remain a member of the European Union", including all 32 voting areas in Scotland. Leave Remain
The final result of the referendum for the United Kingdom and Gibraltar was declared at Manchester Town Hall at 0720 BST on Friday 24 June 2016, after all the 382 voting areas and the twelve UK regions had declared their results, by the Chief Counting Officer (CCO) for the referendum, Jenny Watson. In a UK-wide referendum the position of CCO is held by the chair of the Electoral Commission. The following figures are as reported by the Electoral Commission.
"Leave the European Union" secured a majority of 1,269,501 votes (3.78%) over those who had voted in favour of "Remain a member of the European Union". England (except Greater London) and Wales voted to "Leave", while Scotland and Northern Ireland voted to "Remain".
2016 United Kingdom European Union membership referendum
Choice
Votes
%
Leave the European Union
17,410,742
51.89
Remain a member of the European Union
16,141,241
48.11
Total
33,551,983
100.00
Valid votes
33,551,983
99.92
Invalid/blank votes
25,359
0.08
Total votes
33,577,342
100.00
Registered voters/turnout
46,500,001
72.21
Source: Electoral Commission
National referendum results (excluding invalid votes)
Results from the 30 largest cities in the United Kingdom
Out of over 33.5 million valid votes cast across the United Kingdom, over 8.8 million, or just over one quarter, were cast in thirty major cities that each gathered 100,000 votes or more. 16 of those cities voted to Leave, and 14 voted to Remain, or 53% Leave and 47% Remain.
In those 30 cities, votes to Remain outnumbered those to Leave by over 900,000 (about 4.9 million to 4 million or 55.2% to 44.8%), while in the other voting areas, the votes to Leave outnumbered those to Remain by nearly 2.2 million (about 13.5 million to 11.3 million, or 54.4% to 45.6%).
Notes: [a] Vote totals for Belfast are based on the returns from the four parliamentary constituencies in Belfast. These include areas in districts outside the City of Belfast. [b] Lighter shades indicate a prevailing Remain or Leave vote of 52.0% or less; darker shades one of 58.0% or more. [c] Margins are (arbitrarily) positive (+) when they indicate the excess of Remain votes over Leave, and negative (−) when they indicate the excess of Leave votes over Remain.
Unlike the other constituent countries of the United Kingdom there was no centralised national count of the votes in England as counting was done within the nine separate regions. Figures from Gibraltar are included in the South West England region.
2016 United Kingdom European Union membership referendum(England)(including Gibraltar)
Choice
Votes
%
Leave the European Union
15,188,406
53.38
Remain a member of the European Union
13,266,996
46.62
Valid votes
28,455,482
99.92
Invalid or blank votes
22,184
0.08
Total votes
28,477,666
100.00
Registered voters/turnout
39,005,781
73.01
Source: Electoral Commission
England (including Gibraltar) referendum results (without spoiled ballots):
Northern Ireland was a single voting area, as well as being a regional count although local totals were announced in each of the Westminster parliamentary constituency areas within Northern Ireland.
Northern Ireland Leave Remain
2016 United Kingdom European Union membership referendum(Northern Ireland)
While all council counting areas showed a majority to remain, one constituency, Banff and Buchan, voted to leave by an estimated ratio of 54% to 46%. Voting to leave the EU was most concentrated around the north coast of Aberdeenshire between the fishing towns of Banff and Peterhead, where there were 23,707 Leave votes to 14,918 Remain votes (61% Leave 39% Remain).
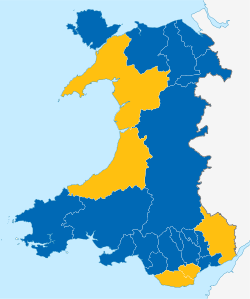
A total of 650,000 inhabitants born in England live in Wales (21%), with the areas with the highest percentages voting to leave. The majority to leave the EU was 82,000. The map shows council areas comprising ex-heavy industrial places and English-speaking as a common preference as areas where Leave won out. Parts of rural Wales also saw a leave-vote majority (but also Anglesey where Welsh is just as commonly if not more usually spoken). Cardiff, the Plaid Cymru heartland of the two council areas in West Wales, and by wafer-thin margins affluent Monmouthshire and the Vale of Glamorgan were the areas where Remain held sway.
2016 United Kingdom European Union membership referendum(Wales/Cymru)
Choice
Votes
%
Leave the European UnionGadael yr Undeb Ewropeaidd
854,572
52.53
Remain a member of the European Union Aros yn aelod o'r Undeb Ewropeaidd
772,347
47.47
Valid votes
1,626,919
99.93
Invalid or blank votes
1,135
0.07
Total votes
1,628,054
100.00
Registered voters/turnout
2,270,272
71.71
Source: Electoral Commission
Note: In Wales under the Welsh Language Act 1993 the Welsh language has equal status with the English language.
Wales referendum results (without spoiled ballots):
The vote was not counted by Commons seat except in Northern Ireland. Some local councils (districts) republished local results by electoral ward or constituency. Some constituencies are coterminous with (overlap) their local government district. For the others Dr Chris Hanretty, a Reader in Politics at the University of East Anglia, estimated through a demographic model the 'Leave' and 'Remain' vote. Hanretty urges caution in the interpretation of the data as the estimates have a margin of error.
Estimated net preference of constituencies by party of the incumbent
Please note that this table does not show how each party's traditional voters voted in the referendum. It shows the estimated (or actual) net decision in 648 of the 650 seats and the incumbents reflect those returned at the 2015 general election.
List of constituency results
While votes were tallied by district, there were two sources of by constituency result available within a short time of the referendum – firstly a model by Chris Hanretty, based on the published results by district, and secondly 82 results calculated by the BBC based on ward results obtained from the local authorities.
Results of the 2016 EU Referendum by constituency (incl. estimates) Leave >70%Leave 65% to 70%Leave 60% to 65%Leave 55% to 60%Leave 52% to 55%Leave <52%Remain <52%Remain 52% to 55%Remain 55% to 60%Remain 60% to 65%Remain 65% to 70%Remain >70%
In the following table, Hanretty's results are marked with "(est.)".
Constituency
Leave
Remain
Boston and Skegness
75.65%
24.35%(est.)
Walsall North
74.19%
25.81%
Clacton
73.04%
26.96%(est.)
South Basildon and East Thurrock
73%
27%(est.)
Kingston upon Hull East
72.83%
27.17%(est.)
Castle Point
72.7%
27.3%
Stoke-on-Trent North
72.12%
27.88%(est.)
Doncaster North
71.65%
28.35%(est.)
Great Yarmouth
71.5%
28.5%
Great Grimsby
71.45%
28.55%
Dudley North
71.43%
28.57%
Stoke-on-Trent South
71.11%
28.89%(est.)
South Holland and The Deepings
71.07%
28.93%(est.)
Barnsley East
70.98%
29.02%(est.)
Mansfield
70.86%
29.14%
Ashfield
70.47%
29.53%(est.)
Dudley South
70.42%
29.58%
Bolsover
70.39%
29.61%(est.)
Dagenham and Rainham
70.35%
29.65%(est.)
Wentworth and Dearne
70.28%
29.72%(est.)
Thurrock
70.26%
29.74%(est.)
Hartlepool
69.57%
30.43%
Cleethorpes
69.5%
30.5%(est.)
Hornchurch and Upminster
69.49%
30.51%
North East Cambridgeshire
69.35%
30.65%(est.)
Romford
69.29%
30.71%
Normanton, Pontefract and Castleford
69.26%
30.74%
Louth and Horncastle
68.9%
31.1%(est.)
Cannock Chase
68.86%
31.14%
Scunthorpe
68.68%
31.32%(est.)
West Bromwich West
68.67%
31.33%(est.)
Don Valley
68.49%
31.51%(est.)
Rotherham
68.35%
31.65%
Bassetlaw
68.32%
31.68%(est.)
Barnsley Central
68.19%
31.81%(est.)
West Bromwich East
68.18%
31.82%(est.)
Wolverhampton South East
68.14%
31.86%
Hemsworth
68.13%
31.87%
Kingston upon Hull West and Hessle
67.99%
32.01%(est.)
Blackpool South
67.81%
32.19%(est.)
Aldridge-Brownhills
67.8%
32.2%
North Warwickshire
67.76%
32.24%(est.)
Harlow
67.73%
32.27%(est.)
Wolverhampton North East
67.71%
32.29%
Redcar
67.67%
32.33%(est.)
Rayleigh and Wickford
67.65%
32.35%(est.)
Basildon and Billericay
67.14%
32.86%(est.)
Blackpool North and Cleveleys
66.91%
33.09%(est.)
Rother Valley
66.72%
33.28%
Doncaster Central
66.7%
33.3%(est.)
South West Norfolk
66.67%
33.33%(est.)
Burnley
66.61%
33.39%
Halesowen and Rowley Regis
66.59%
33.41%(est.)
Plymouth, Moor View
66.44%
33.56%
Stockton North
66.32%
33.68%(est.)
Sheffield South East
66.32%
33.68%(est.)
Brigg and Goole
66.23%
33.77%(est.)
Telford
66.19%
33.81%(est.)
Middlesbrough
66.08%
33.92%
Tamworth
65.99%
34.01%(est.)
Easington
65.96%
34.04%(est.)
Hyndburn
65.82%
34.18%(est.)
North West Norfolk
65.78%
34.22%(est.)
Broxbourne
65.53%
34.47%(est.)
Gravesham
65.38%
34.62%
Sittingbourne and Sheppey
65.36%
34.64%(est.)
Amber Valley
65.3%
34.7%(est.)
Middlesbrough South and East Cleveland
65.27%
34.73%(est.)
Bexleyheath and Crayford
65.26%
34.74%(est.)
South Staffordshire
65.24%
34.76%
North Thanet
65.18%
34.82%(est.)
Makerfield
64.91%
35.09%(est.)
Stoke-on-Trent Central
64.85%
35.15%(est.)
Burton
64.79%
35.21%(est.)
Bognor Regis and Littlehampton
64.79%
35.21%(est.)
Staffordshire Moorlands
64.69%
35.31%(est.)
Nuneaton
64.51%
35.49%(est.)
St Austell and Newquay
64.06%
35.94%(est.)
Dartford
63.98%
36.02%(est.)
Chatham and Aylesford
63.91%
36.09%(est.)
Nottingham North
63.81%
36.19%
Portsmouth North
63.69%
36.31%
Rochester and Strood
63.69%
36.31%
Stourbridge
63.66%
36.34%
East Yorkshire
63.66%
36.34%(est.)
Sherwood
63.66%
36.34%(est.)
Gillingham and Rainham
63.58%
36.42%
Bradford South
63.56%
36.44%
Waveney
63.41%
36.59%(est.)
Leigh
63.29%
36.71%(est.)
West Suffolk
63.25%
36.75%(est.)
Erewash
63.22%
36.78%(est.)
Pendle
63.15%
36.85%
Wyre Forest
63.15%
36.85%
Bolton South East
63.03%
36.97%(est.)
Wellingborough
63.02%
36.98%(est.)
Dover
63.01%
36.99%(est.)
Birmingham, Erdington
63%
37%
Wigan
62.96%
37.04%(est.)
Wakefield
62.77%
37.23%
Peterborough
62.68%
37.32%(est.)
Havant
62.62%
37.38%(est.)
Torbay
62.45%
37.55%(est.)
Houghton and Sunderland South
62.43%
37.57%
Old Bexley and Sidcup
62.43%
37.57%(est.)
Heywood and Middleton
62.43%
37.57%
North Antrim
62.22%
37.78%
Bridgwater and West Somerset
62.06%
37.94%(est.)
South Shields
62.05%
37.95%
North East Derbyshire
62.05%
37.95%(est.)
Blaenau Gwent
62.03%
37.97%
Gainsborough
61.96%
38.04%(est.)
Isle of Wight
61.95%
38.05%
Washington and Sunderland West
61.85%
38.15%
Gosport
61.82%
38.18%(est.)
Ashton-under-Lyne
61.81%
38.19%
Birmingham, Northfield
61.8%
38.2%
Swansea East
61.79%
38.21%(est.)
Jarrow
61.78%
38.22%(est.)
South Thanet
61.69%
38.31%(est.)
Newcastle-under-Lyme
61.64%
38.36%(est.)
Folkestone and Hythe
61.64%
38.36%(est.)
Walsall South
61.64%
38.36%
Warley
61.63%
38.37%(est.)
Sleaford and North Hykeham
61.58%
38.42%(est.)
Braintree
61.52%
38.48%(est.)
Leeds East
61.44%
38.56%(est.)
Derby South
61.35%
38.65%(est.)
Scarborough and Whitby
61.32%
38.68%(est.)
Oldham West and Royton
61.31%
38.69%
Brentwood and Ongar
61.19%
38.81%(est.)
Epping Forest
61.01%
38.99%(est.)
Workington
61.01%
38.99%(est.)
Grantham and Stamford
61%
39%(est.)
Redditch
60.99%
39.01%(est.)
Kettering
60.99%
39.01%
Denton and Reddish
60.98%
39.02%
Maldon
60.96%
39.04%(est.)
Rochford and Southend East
60.92%
39.08%(est.)
Bishop Auckland
60.89%
39.11%(est.)
Bosworth
60.83%
39.17%(est.)
Torfaen
60.78%
39.22%(est.)
North West Leicestershire
60.7%
39.3%
Penistone and Stocksbridge
60.65%
39.35%(est.)
Carlisle
60.64%
39.36%(est.)
Mid Norfolk
60.6%
39.4%(est.)
Blyth Valley
60.49%
39.51%(est.)
Witham
60.47%
39.53%(est.)
Rhondda
60.45%
39.55%(est.)
Hereford and South Herefordshire
60.42%
39.58%(est.)
South Derbyshire
60.35%
39.65%
North Durham
60.3%
39.7%(est.)
Spelthorne
60.3%
39.7%
Southampton, Itchen
60.29%
39.71%(est.)
Crewe and Nantwich
60.29%
39.71%(est.)
Northampton North
60.27%
39.73%(est.)
North Cornwall
60.19%
39.81%(est.)
New Forest East
60.18%
39.82%(est.)
Corby
60.15%
39.85%(est.)
Aberavon
60.12%
39.88%(est.)
Birmingham, Yardley
60.1%
39.9%
Barking
59.97%
40.03%(est.)
Sheffield, Brightside and Hillsborough
59.97%
40.03%(est.)
Christchurch
59.96%
40.04%(est.)
Sunderland Central
59.94%
40.06%
Oldham East and Saddleworth
59.92%
40.08%
Clwyd South
59.88%
40.12%(est.)
Yeovil
59.87%
40.13%(est.)
Ashford
59.86%
40.14%(est.)
North Shropshire
59.85%
40.15%(est.)
Morley and Outwood
59.82%
40.18%(est.)
Worsley and Eccles South
59.79%
40.21%
Kingston upon Hull North
59.79%
40.21%(est.)
Batley and Spen
59.63%
40.37%(est.)
North Tyneside
59.52%
40.48%(est.)
South Dorset
59.45%
40.55%(est.)
Sedgefield
59.44%
40.56%(est.)
Mid Worcestershire
59.39%
40.61%(est.)
Newport East
59.33%
40.67%(est.)
The Wrekin
59.32%
40.68%(est.)
Chesterfield
59.29%
40.71%(est.)
Stalybridge and Hyde
59.29%
40.71%
Copeland
59.2%
40.8%(est.)
Luton North
59.15%
40.85%(est.)
Harwich and North Essex
59%
41%(est.)
Northampton South
59%
41%(est.)
Islwyn
58.94%
41.06%(est.)
Rossendale and Darwen
58.94%
41.06%(est.)
Ogmore
58.9%
41.1%(est.)
Halifax
58.82%
41.18%
Gloucester
58.81%
41.19%(est.)
Meriden
58.81%
41.19%
Beverley and Holderness
58.74%
41.26%(est.)
Ribble Valley
58.73%
41.27%(est.)
Faversham and Mid Kent
58.67%
41.33%(est.)
Rugby
58.62%
41.38%(est.)
Daventry
58.59%
41.41%(est.)
Crawley
58.41%
41.59%
Camborne and Redruth
58.41%
41.59%(est.)
North Norfolk
58.4%
41.6%(est.)
St Helens North
58.39%
41.61%(est.)
Coventry North West
58.37%
41.63%(est.)
Merthyr Tydfil and Rhymney
58.35%
41.65%(est.)
Ellesmere Port and Neston
58.34%
41.66%(est.)
Hayes and Harlington
58.25%
41.75%(est.)
Morecambe and Lunesdale
58.19%
41.81%(est.)
South Leicestershire
58.14%
41.86%(est.)
Bolton North East
58.11%
41.89%(est.)
Darlington
58.1%
41.9%(est.)
South West Bedfordshire
58.08%
41.92%(est.)
Warrington North
58.07%
41.93%(est.)
Alyn and Deeside
58.05%
41.95%(est.)
North Herefordshire
58.02%
41.98%(est.)
Aldershot
57.9%
42.1%
Forest of Dean
57.89%
42.11%(est.)
Ludlow
57.88%
42.12%(est.)
Charnwood
57.87%
42.13%(est.)
Tiverton and Honiton
57.82%
42.18%(est.)
Coventry North East
57.77%
42.23%(est.)
Stockton South
57.76%
42.24%(est.)
Bournemouth West
57.73%
42.27%(est.)
Bexhill and Battle
57.72%
42.28%(est.)
Halton
57.67%
42.33%(est.)
Selby and Ainsty
57.65%
42.35%(est.)
Wrexham
57.57%
42.43%(est.)
Eastbourne
57.54%
42.46%(est.)
Orpington
57.54%
42.46%
Stone
57.54%
42.46%(est.)
Lichfield
57.51%
42.49%(est.)
Stafford
57.46%
42.54%(est.)
Rochdale
57.45%
42.55%
Lincoln
57.43%
42.57%(est.)
Poole
57.42%
42.58%(est.)
North Swindon
57.29%
42.71%(est.)
Barrow and Furness
57.28%
42.72%(est.)
Weston-Super-Mare
57.2%
42.8%(est.)
Torridge and West Devon
57.19%
42.81%(est.)
Uxbridge and South Ruislip
57.19%
42.81%(est.)
Sheffield, Heeley
57.16%
42.84%(est.)
Dewsbury
57.15%
42.85%(est.)
Kingswood
57.12%
42.88%(est.)
Mid Dorset and North Poole
57.08%
42.92%(est.)
North Devon
57.04%
42.96%
Stevenage
57.04%
42.96%(est.)
North West Cambridgeshire
56.93%
43.07%(est.)
South West Wiltshire
56.88%
43.12%(est.)
Newcastle upon Tyne North
56.83%
43.17%(est.)
Elmet and Rothwell
56.79%
43.21%(est.)
Chorley
56.75%
43.25%(est.)
Cynon Valley
56.73%
43.27%(est.)
Fylde
56.73%
43.27%(est.)
Norwich North
56.73%
43.27%(est.)
Llanelli
56.67%
43.33%(est.)
South Ribble
56.64%
43.36%(est.)
North Dorset
56.61%
43.39%(est.)
Vale of Clwyd
56.56%
43.44%(est.)
Ipswich
56.52%
43.48%(est.)
Thirsk and Malton
56.43%
43.57%(est.)
Gedling
56.3%
43.7%(est.)
Wansbeck
56.29%
43.71%(est.)
Carshalton and Wallington
56.26%
43.74%(est.)
Gateshead
56.22%
43.78%(est.)
Blaydon
56.12%
43.88%(est.)
St Helens South and Whiston
56.05%
43.95%(est.)
Worthing West
56.02%
43.98%(est.)
Newton Abbot
56.01%
43.99%(est.)
Hastings and Rye
55.94%
44.06%(est.)
Feltham and Heston
55.93%
44.07%
Maidstone and The Weald
55.92%
44.08%(est.)
Montgomeryshire
55.84%
44.16%(est.)
Newark
55.7%
44.3%(est.)
Preston
55.67%
44.33%(est.)
Bolton West
55.55%
44.45%(est.)
Strangford
55.53%
44.47%
Fareham
55.52%
44.48%(est.)
Hemel Hempstead
55.49%
44.51%(est.)
Bromsgrove
55.37%
44.63%
Preseli Pembrokeshire
55.32%
44.68%(est.)
Berwick-upon-Tweed
55.3%
44.7%(est.)
New Forest West
55.26%
44.74%(est.)
Haltemprice and Howden
55.23%
44.77%(est.)
Suffolk Coastal
55.21%
44.79%(est.)
Penrith and The Border
55.2%
44.8%(est.)
East Antrim
55.19%
44.81%
Carmarthen West and South Pembrokeshire
55.16%
44.84%(est.)
Bradford East
55.16%
44.84%
Caerphilly
55.14%
44.86%(est.)
South East Cornwall
55.1%
44.9%(est.)
South West Devon
55.08%
44.92%(est.)
Southend West
55.07%
44.93%
North West Durham
55.05%
44.95%(est.)
West Lancashire
54.95%
45.05%(est.)
Central Suffolk and North Ipswich
54.89%
45.11%(est.)
Bootle
54.8%
45.2%(est.)
St Ives
54.77%
45.23%(est.)
North West Hampshire
54.75%
45.25%(est.)
Richmond (Yorks)
54.71%
45.29%(est.)
Erith and Thamesmead
54.63%
45.37%(est.)
Luton South
54.6%
45.4%(est.)
Bury South
54.51%
45.49%(est.)
Delyn
54.41%
45.59%(est.)
Plymouth, Sutton and Devonport
54.41%
45.59%
Wolverhampton South West
54.37%
45.63%
Eastleigh
54.35%
45.65%(est.)
Derby North
54.25%
45.75%(est.)
East Surrey
54.2%
45.8%(est.)
Wyre and Preston North
54.2%
45.8%(est.)
Broadland
54.1%
45.9%(est.)
Leicester East
54.06%
45.94%(est.)
Slough
54.06%
45.94%(est.)
Sevenoaks
54.04%
45.96%(est.)
South Suffolk
54.03%
45.97%(est.)
Neath
54.02%
45.98%(est.)
Bury St Edmunds
53.99%
46.01%(est.)
Totnes
53.89%
46.11%(est.)
Rutland and Melton
53.88%
46.12%(est.)
Blackburn
53.73%
46.27%
Bournemouth East
53.69%
46.31%(est.)
East Worthing and Shoreham
53.68%
46.32%(est.)
Worcester
53.68%
46.32%
Bury North
53.67%
46.33%(est.)
Newport West
53.66%
46.34%(est.)
Tewkesbury
53.65%
46.35%(est.)
Wells
53.63%
46.37%(est.)
Basingstoke
53.6%
46.4%(est.)
Banff and Buchan
53.59%
46.41%(est.)
Salford and Eccles
53.59%
46.41%
Devizes
53.53%
46.47%(est.)
Huntingdon
53.49%
46.51%(est.)
North East Bedfordshire
53.44%
46.56%(est.)
Solihull
53.35%
46.65%
South Northamptonshire
53.34%
46.66%(est.)
Keighley
53.33%
46.67%
Ilford North
53.31%
46.69%(est.)
Leeds West
53.27%
46.73%(est.)
Bracknell
53.24%
46.76%(est.)
Carmarthen East and Dinefwr
53.21%
46.79%(est.)
Skipton and Ripon
53.19%
46.81%(est.)
Calder Valley
53.16%
46.84%
Lagan Valley
53.09%
46.91%
Milton Keynes South
53.08%
46.92%(est.)
Clwyd West
53.01%
46.99%(est.)
Taunton Deane
52.92%
47.08%
Shrewsbury and Atcham
52.92%
47.08%(est.)
Mid Bedfordshire
52.88%
47.12%(est.)
Tonbridge and Malling
52.86%
47.14%(est.)
Welwyn Hatfield
52.82%
47.18%(est.)
Wealden
52.77%
47.23%(est.)
Upper Bann
52.62%
47.38%
Congleton
52.61%
47.39%(est.)
Vale of Glamorgan
52.55%
47.45%(est.)
West Worcestershire
52.52%
47.48%(est.)
Broxtowe
52.51%
47.49%(est.)
Mid Derbyshire
52.47%
47.53%(est.)
Harborough
52.37%
47.63%(est.)
Knowsley
52.34%
47.66%(est.)
Shipley
52.21%
47.79%
Hazel Grove
52.21%
47.79%
Aberconwy
52.2%
47.8%(est.)
Thornbury and Yate
52.19%
47.81%(est.)
Liverpool, Walton
52.17%
47.83%(est.)
Eddisbury
52.17%
47.83%(est.)
Lancaster and Fleetwood
51.99%
48.01%(est.)
Bedford
51.95%
48.05%
Belfast East
51.94%
48.06%
Meon Valley
51.93%
48.07%(est.)
Brecon and Radnorshire
51.86%
48.14%(est.)
Surrey Heath
51.85%
48.15%(est.)
Huddersfield
51.85%
48.15%(est.)
Eltham
51.82%
48.18%
Aylesbury
51.79%
48.21%(est.)
Portsmouth South
51.76%
48.24%
Birkenhead
51.71%
48.29%
Sutton Coldfield
51.7%
48.3%
South Swindon
51.65%
48.35%(est.)
North East Somerset
51.63%
48.37%(est.)
Chippenham
51.59%
48.41%(est.)
Colchester
51.51%
48.49%(est.)
Reading West
51.51%
48.49%(est.)
Birmingham, Hodge Hill
51.5%
48.5%
North East Hertfordshire
51.43%
48.57%(est.)
Caithness, Sutherland and Easter Ross
51.34%
48.66%(est.)
Sutton and Cheam
51.28%
48.72%(est.)
Saffron Walden
51.24%
48.76%(est.)
Derbyshire Dales
51.24%
48.76%(est.)
Birmingham, Perry Barr
51.2%
48.8%
Watford
51.15%
48.85%(est.)
Warrington South
51.11%
48.89%(est.)
West Dorset
51.04%
48.96%(est.)
Stratford-on-Avon
51%
49%(est.)
Ynys Mon
50.94%
49.06%
Central Devon
50.89%
49.11%(est.)
South Norfolk
50.88%
49.12%(est.)
Hertsmere
50.84%
49.16%
Leicester West
50.84%
49.16%(est.)
Chichester
50.73%
49.27%(est.)
Chelmsford
50.68%
49.32%(est.)
Weaver Vale
50.55%
49.45%(est.)
High Peak
50.55%
49.45%
East Devon
50.41%
49.59%(est.)
Coventry South
50.38%
49.62%(est.)
Banbury
50.35%
49.65%(est.)
Somerton and Frome
50.33%
49.67%(est.)
Croydon Central
50.31%
49.69%
North Wiltshire
50.3%
49.7%(est.)
Bridgend
50.28%
49.72%(est.)
Loughborough
50.09%
49.91%(est.)
Colne Valley
50.06%
49.94%(est.)
Blackley and Broughton
50.04%
49.96%(est.)
Wallasey
49.92%
50.08%
Salisbury
49.91%
50.09%(est.)
Chingford and Woodford Green
49.88%
50.12%(est.)
Moray
49.87%
50.13%
Runnymede and Weybridge
49.85%
50.15%(est.)
Bromley and Chislehurst
49.83%
50.17%
Liverpool, West Derby
49.82%
50.18%(est.)
Arundel and South Downs
49.7%
50.3%(est.)
Milton Keynes North
49.67%
50.33%(est.)
Wythenshawe and Sale East
49.65%
50.35%(est.)
Belfast North
49.64%
50.36%
Ruislip, Northwood and Pinner
49.54%
50.46%(est.)
Horsham
49.49%
50.51%(est.)
Southampton, Test
49.41%
50.59%(est.)
Gower
49.31%
50.69%(est.)
East Hampshire
49.27%
50.73%(est.)
Hertford and Stortford
49.24%
50.76%(est.)
Enfield North
49.22%
50.78%
Beaconsfield
49.01%
50.99%(est.)
Stretford and Urmston
48.91%
51.09%(est.)
Buckingham
48.87%
51.13%(est.)
Filton and Bradley Stoke
48.77%
51.23%(est.)
Pudsey
48.58%
51.42%(est.)
Wycombe
48.46%
51.54%(est.)
Angus
48.24%
51.76%(est.)
Monmouth
48.06%
51.94%(est.)
Newcastle upon Tyne Central
48%
52%(est.)
Reigate
47.98%
52.02%(est.)
East Londonderry
47.97%
52.03%
West Ham
47.97%
52.03%(est.)
Garston and Halewood
47.96%
52.04%(est.)
The Cotswolds
47.92%
52.08%(est.)
Newbury
47.81%
52.19%(est.)
Epsom and Ewell
47.78%
52.22%(est.)
North Down
47.64%
52.36%
Tynemouth
47.64%
52.36%(est.)
Glenrothes
47.61%
52.39%(est.)
North Somerset
47.58%
52.42%(est.)
Harrow East
47.48%
52.52%
Dwyfor Meirionnydd
47.43%
52.57%(est.)
Mole Valley
47.31%
52.69%(est.)
Birmingham, Edgbaston
47.3%
52.7%
Macclesfield
47.18%
52.82%(est.)
Harrogate and Knaresborough
47.18%
52.82%(est.)
Lewes
47.14%
52.86%(est.)
Bristol South
47.14%
52.86%
Westmorland and Lonsdale
47.06%
52.94%(est.)
Birmingham, Selly Oak
46.9%
53.1%
Bristol East
46.8%
53.2%
Stockport
46.79%
53.21%
Bradford West
46.74%
53.26%
Windsor
46.66%
53.34%(est.)
Beckenham
46.58%
53.42%(est.)
Wirral South
46.55%
53.45%
Pontypridd
46.51%
53.49%(est.)
Nottingham South
46.47%
53.53%
Wantage
46.46%
53.54%(est.)
Mid Sussex
46.44%
53.56%(est.)
Witney
46.34%
53.66%
Southport
46.29%
53.71%(est.)
East Ham
46.27%
53.73%(est.)
Ealing North
46.26%
53.74%
Kenilworth and Southam
46.21%
53.79%(est.)
South West Hertfordshire
46.2%
53.8%(est.)
North East Hampshire
46.18%
53.82%(est.)
Romsey and Southampton North
46.08%
53.92%(est.)
Leeds Central
45.96%
54.04%(est.)
Stroud
45.86%
54.14%(est.)
Truro and Falmouth
45.85%
54.15%(est.)
Croydon South
45.81%
54.19%
Tatton
45.63%
54.37%(est.)
Edmonton
45.51%
54.49%
Ceredigion
45.37%
54.63%
Hexham
45.34%
54.66%(est.)
Canterbury
45.33%
54.67%(est.)
South East Cambridgeshire
45.3%
54.7%(est.)
Dumfries and Galloway
45.11%
54.89%(est.)
Harrow West
45.06%
54.94%
Maidenhead
45.03%
54.97%(est.)
Chesham and Amersham
44.98%
55.02%
Exeter
44.83%
55.17%(est.)
Na h-Eileanan an Iar
44.76%
55.24%
Wirral West
44.69%
55.31%
Mitcham and Morden
44.69%
55.31%
York Outer
44.67%
55.33%(est.)
Tunbridge Wells
44.65%
55.35%(est.)
Dumfriesshire, Clydesdale and Tweeddale
44.65%
55.35%(est.)
Gordon
44.29%
55.71%(est.)
Woking
44.25%
55.75%(est.)
Ayr, Carrick and Cumnock
44.11%
55.89%(est.)
Sefton Central
44.09%
55.91%(est.)
Glasgow East
43.84%
56.16%
Cardiff West
43.82%
56.18%(est.)
Brighton, Kemptown
43.59%
56.41%(est.)
Ross, Skye and Lochaber
43.49%
56.51%(est.)
Swansea West
43.4%
56.6%(est.)
City of Durham
43.34%
56.66%(est.)
Ilford South
43.31%
56.69%(est.)
Brentford and Isleworth
43.31%
56.69%
Kirkcaldy and Cowdenbeath
43.26%
56.74%(est.)
Livingston
43.26%
56.74%(est.)
Berwickshire, Roxburgh and Selkirk
43.26%
56.74%(est.)
Aberdeen North
43.09%
56.91%(est.)
Henley
43.09%
56.91%(est.)
Cheltenham
42.9%
57.1%(est.)
Brent Central
42.89%
57.11%(est.)
Nottingham East
42.88%
57.12%
Cardiff South and Penarth
42.82%
57.18%(est.)
Wokingham
42.69%
57.31%(est.)
Cheadle
42.65%
57.35%
Brent North
42.61%
57.39%(est.)
Leicester South
42.44%
57.56%(est.)
North Ayrshire and Arran
42.4%
57.6%(est.)
City of Chester
42.28%
57.72%(est.)
Falkirk
42.11%
57.89%(est.)
Linlithgow and East Falkirk
42.02%
57.98%(est.)
Ealing, Southall
41.83%
58.17%
Warwick and Leamington
41.64%
58.36%(est.)
Central Ayrshire
41.62%
58.38%(est.)
Bristol North West
41.6%
58.4%
Hendon
41.57%
58.43%(est.)
Esher and Walton
41.57%
58.43%(est.)
Rushcliffe
41.47%
58.53%(est.)
Fermanagh and South Tyrone
41.44%
58.56%
Guildford
41.2%
58.8%(est.)
South Antrim
41.18%
58.82%
Croydon North
41.17%
58.83%
Chipping Barnet
41.07%
58.93%(est.)
Newcastle upon Tyne East
41.07%
58.93%(est.)
Glasgow South West
40.86%
59.14%
Kingston and Surbiton
40.84%
59.16%(est.)
South West Surrey
40.75%
59.25%(est.)
Dundee West
40.75%
59.25%(est.)
Glasgow North East
40.66%
59.34%
Norwich South
40.53%
59.47%(est.)
Orkney and Shetland
40.28%
59.72%(est.)
Inverness, Nairn, Badenoch and Strathspey
40.13%
59.87%(est.)
Perth and North Perthshire
39.9%
60.1%(est.)
Airdrie and Shotts
39.84%
60.16%(est.)
Hitchin and Harpenden
39.79%
60.21%
Winchester
39.64%
60.36%(est.)
Mid Ulster
39.61%
60.39%
Ochil and South Perthshire
39.5%
60.5%(est.)
Kilmarnock and Loudoun
39.45%
60.55%(est.)
Argyll and Bute
39.43%
60.57%
Dunfermline and West Fife
39.39%
60.61%(est.)
West Aberdeenshire and Kincardine
39.17%
60.83%(est.)
Cardiff North
39.15%
60.85%(est.)
York Central
38.82%
61.18%(est.)
Coatbridge, Chryston and Bellshill
38.78%
61.22%(est.)
Altrincham and Sale West
38.59%
61.41%(est.)
South Cambridgeshire
38.49%
61.51%(est.)
Dundee East
38.41%
61.59%(est.)
Reading East
38.25%
61.75%(est.)
Manchester, Gorton
38.21%
61.79%(est.)
Oxford West and Abingdon
38.03%
61.97%(est.)
West Dunbartonshire
38.01%
61.99%
Midlothian
37.94%
62.06%
Enfield, Southgate
37.88%
62.12%
St Albans
37.83%
62.17%(est.)
Motherwell and Wishaw
37.71%
62.29%(est.)
Rutherglen and Hamilton West
37.57%
62.43%(est.)
Leeds North East
37.42%
62.58%(est.)
Newry and Armagh
37.06%
62.94%
Cumbernauld, Kilsyth and Kirkintilloch East
36.99%
63.01%(est.)
East Kilbride, Strathaven and Lesmahagow
36.93%
63.07%(est.)
Manchester Central
36.36%
63.64%(est.)
North East Fife
36.31%
63.69%(est.)
Inverclyde
36.2%
63.8%
Lanark and Hamilton East
35.96%
64.04%(est.)
Arfon
35.85%
64.15%(est.)
Greenwich and Woolwich
35.67%
64.33%
Birmingham, Ladywood
35.6%
64.4%
Paisley and Renfrewshire North
35.55%
64.45%(est.)
Leeds North West
35.41%
64.59%(est.)
East Lothian
35.4%
64.6%
Lewisham East
35.37%
64.63%(est.)
Liverpool, Wavertree
35.26%
64.74%(est.)
Paisley and Renfrewshire South
34.8%
65.2%(est.)
Leyton and Wanstead
34.76%
65.24%(est.)
Lewisham West and Penge
34.59%
65.41%(est.)
Poplar and Limehouse
34.21%
65.79%(est.)
Sheffield, Hallam
34.01%
65.99%(est.)
Westminster North
33.65%
66.35%(est.)
Birmingham, Hall Green
33.6%
66.4%
Walthamstow
33.49%
66.51%
Twickenham
33.32%
66.68%(est.)
West Tyrone
33.15%
66.85%
Hove
32.95%
67.05%(est.)
South Down
32.76%
67.24%
Oxford East
32.53%
67.47%(est.)
Stirling
32.28%
67.72%
Aberdeen South
32.14%
67.86%(est.)
Cardiff Central
32.01%
67.99%(est.)
Sheffield Central
31.91%
68.09%(est.)
Bath
31.72%
68.28%(est.)
Glasgow North West
31.49%
68.51%
Camberwell and Peckham
31.48%
68.52%(est.)
Hammersmith
31.31%
68.69%(est.)
Kensington
31.2%
68.8%(est.)
Finchley and Golders Green
31.1%
68.9%(est.)
Bethnal Green and Bow
30.86%
69.14%(est.)
Belfast South
30.51%
69.49%
Wimbledon
29.37%
70.63%
Ealing Central and Acton
29.15%
70.85%
Chelsea and Fulham
29.1%
70.9%(est.)
Edinburgh West
28.77%
71.23%
Glasgow Central
28.75%
71.25%
Richmond Park
28.69%
71.31%(est.)
Islington South and Finsbury
28.28%
71.72%
Glasgow South
28.19%
71.81%
Cities of London and Westminster
28.05%
71.95%(est.)
Edinburgh South West
27.86%
72.14%
Putney
27.76%
72.24%(est.)
Edinburgh East
27.64%
72.36%
Liverpool, Riverside
27.3%
72.7%(est.)
East Dunbartonshire
26.87%
73.13%(est.)
Holborn and St Pancras
26.66%
73.34%
Cambridge
26.23%
73.77%
Bermondsey and Old Southwark
26.05%
73.95%(est.)
Belfast West
25.94%
74.06%
Brighton, Pavilion
25.93%
74.07%(est.)
East Renfrewshire
25.68%
74.32%
Tooting
25.59%
74.41%(est.)
Hornsey and Wood Green
24.98%
75.02%
Manchester, Withington
24.94%
75.06%(est.)
Lewisham, Deptford
24.43%
75.57%(est.)
Tottenham
23.78%
76.22%
Hampstead and Kilburn
23.73%
76.27%(est.)
Dulwich and West Norwood
22.94%
77.06%(est.)
Hackney South and Shoreditch
22.78%
77.22%(est.)
Vauxhall
22.43%
77.57%
Edinburgh South
22.15%
77.85%
Battersea
22.05%
77.95%(est.)
Edinburgh North and Leith
21.8%
78.2%
Foyle
21.74%
78.26%
Glasgow North
21.62%
78.38%
Islington North
21.61%
78.39%
Bristol West
20.71%
79.29%
Streatham
20.54%
79.46%
Hackney North and Stoke Newington
20.48%
79.52%(est.)
Most heavily tilted areas
Most heavily Leave areas
The following were the ten voting areas that voted most heavily in favour of leave. All but one of them were in the East Midlands and East of England regions, with four of the ten, including the top two, located in Lincolnshire.
The narrowest margin of victory for any of the 382 voting areas in the United Kingdom was in the Scottish council area of Moray, which voted by just 122 votes or 0.25% margin in favour of Remain.
In England the narrowest margins of victory for Leave were in Watford which voted by just 252 votes or 0.54% margin in favour of Leave, and in Cherwell which voted by just 500 votes or 0.61% margin in favour of Leave. The narrowest margin of victory for Remain was in the London Borough of Bromley, which voted by just 2,364 votes or a 1.30% margin in favour of Remain.
The area with the closest vote to the national result of 51.89% for Leave, was Basingstoke and Deane, where 51.90% of people voted Leave.
After the referendum, the annual British Social Attitudes survey questioned the public on their participation. Interviewing was mainly carried out between July and October 2016 and respondents were subdivided into three age groups (18–34, 35–64 and >/=65). The survey revealed that turnout was higher in the older age groups, and was 64%, 80% and 89% respectively. The age disparity had also been a feature of previous elections and referendums. However, compared to the previous referendum in 2011, the young voters' turnout in 2016 had increased sharply by 31%, while turnout by the two older age categories had also increased, but only by 26% and 21%.
Irregularities
In July 2018, Vote Leave was found by the Electoral Commission to have broken electoral law, spending over its limit. Connected to this, the Information Commissioner's Office found that data had been unlawfully harvested from UK voters, and issued a notice of intent to fine Facebook £500,000. Also, the House of Commons Culture, Media and Sport Select Committee, released an interim report on "Disinformation and 'fake news'", stating that Russia had engaged in "unconventional warfare" through Twitter and other social media against the United Kingdom, designed to amplify support for a "leave" vote in Brexit. It also found that it could not be satisfied that the largest donor in the Brexit campaign, Arron Banks, used money from UK sources, and found that he might have been financed by the Russian government. This led to litigation to declare the result void. Kyle Taylor of the Fair Vote Project, a campaign group that called for a public inquiry and supported a second referendum, said: "The issue is too big to have half the country or more than half the country, wonder 'was that actually the result? Is this the future the country wants?' That's first and foremost, let's be certain, everybody play by the rules." Taylor maintains further, "on the basis of fairness, it has to be the same vote posed in the same way."
In July 2018 the Electoral Commission, Information Commissioner's Office, and the House of Commons Digital, Culture, Media and Sport Committee issued reports, finding variously criminal offences of overspending by Vote Leave, data offences, and foreign interference by Russia. In August 2018, this led to legal challenges to declare the referendum void for violating common law and United Kingdom constitutional law. In May 2020, the Electoral Commission, which had referred Banks to the National Crime Agency for investigation of these allegations, conceded that he did not break electoral law during the 2016 EU referendum campaign.